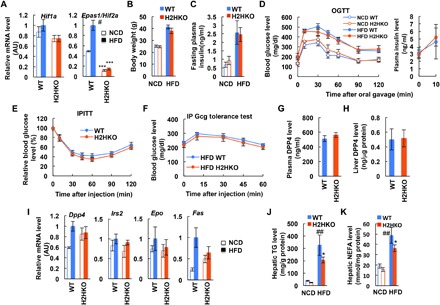
Fig. 4. Deletion of hepatocyte HIF-2α does not affect obesity-induced glucose, glucagon, and insulin intolerance.

(A) Liver Hif1a and Epas1/Hif2a mRNA levels (n = 4, 4, 6, and 9 mice per group). ***P < 0.0001 versus WT counterparts, #P < 0.05 versus NCD WT. (B) Body weight (n = 4, 5, 6, and 9 mice per group). (C) Fasting plasma insulin levels (n = 4, 5, 6, and 9 mice per group). (D) OGTTs and plasma insulin levels during OGTT (n = 4, 5, 6, and 9 mice per group). (E) IPITTs in HFD mice (n = 6 WT and 9 KO mice). (F) Glucagon tolerance tests in HFD mice (n = 11 WT and 8 KO mice). (G) Plasma DPP4 levels in HFD mice (n = 6 WT and 9 KO mice). (H) Liver DPP4 expression in HFD mice (n = 6 WT and 9 KO mice). (I) mRNA levels in liver (n = 4, 4, 6, and 9 mice per group). (J and K) Liver triglyceride (TG) (J) or nonesterified fatty acid (NEFA) (K) content (n = 6 WT and 9 KO mice). *P < 0.05 versus lane 3, ##P < 0.01 versus lane 1. For statistical analysis, one-way ANOVA with post hoc t tests between the individual groups was performed. All data are presented as means ± SEM.
