
Fig. 3. PET detects CD19-tPSMA CAR T cells with high sensitivity in vitro and in vivo.
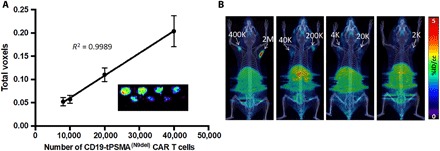
(A) Standard curve demonstrating a linear relationship between the PET signal and the number of CD19-tPSMA(N9Del) CAR T cells. Inset: In vitro phantom from which the standard curve was derived. The in vitro phantom used varying numbers of CD19-tPSMA(N9del) CAR T cells incubated with 37 MBq of [18F]DCFPyL, a high affinity, positron-emitting ligand targeting PSMA, in a 384-well plate. Plates were scanned using the SuperArgus small-animal PET/CT device at 1 hour after beginning the incubation. There were three rows and eight columns of wells presented in a checkerboard pattern: (top row) 40,000, 20,000, 10,000, and 8000 cells; (middle row) 6000, 4000, 2000, and 1000 cells; and (bottom row) 800, 600, 400, and 200 cells. Detection limit was at or near 2000 cells. Images from one of eight separate plates are shown. Error bars, SD; n = 8. (B) Representative images of NSG mice injected with the indicated number (K = 1000; M = 1 × 10⁶) of CD19-tPSMA(N9del) CAR T cells in 50 μl (50% Matrigel) in the shoulders (white arrows); n = 5. Mice were imaged on the SuperArgus small-animal PET/CT at 1 hour after injection of 14.8 MBq of [18F]DCFPyL. PET data are expressed in percentage of injected dose per cubic centimeter of tissue imaged (%ID/cc). To improve the display contrast of the in vivo images, relatively high renal radiotracer uptake was masked using a thresholding method.