
Fig. 4. PSMA PET/CT enables visualization of CD19-tPSMA(N9del) CAR T cell infiltration into local and metastatic tumors.
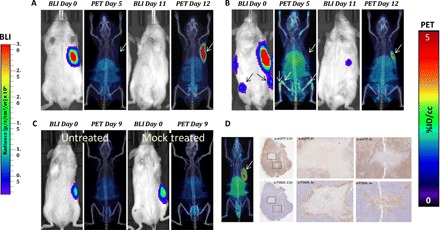
Tumors were derived from Nalm6-eGFP-fLuc cells. (A and B) Mice were infused with 2 × 10⁶ CD19-tPSMA(N9del) CAR T cells; n = 5. (C) Untreated (left mouse) and treated (right mouse) with infusion of 2 × 10⁶ mock T cells. Mice were imaged on the SuperArgus small-animal PET/CT at 1 hour after injection of 14.8 MBq of [18F]DCFPyL and were evaluated at various times (in days) after infusion of the CAR T cells, as indicated. Images alternate between fLuc-tagged bioluminescence (BLI, radiance) for visualization of tumor cells and PET/CT for T cells, with each mouse undergoing both imaging studies; n = 2. (D) Tumor was dissected and stained with anti-PSMA antibody for CD19-tPSMA(N9del) CAR T cells and anti–enhanced green fluorescent protein (eGFP) antibody for tumor cells. CAR T cells infiltrated into the center of the tumor (magnification boxes). Regions where CD19-tPSMA(N9del) CAR T cells infiltrated stained negative with anti-eGFP antibody, indicating tumor cell death. This is a representative example of n = 8. PET data are expressed in percentage of injected dose per cubic centimeter of tissue imaged (%ID/cc). To improve the display contrast of the in vivo images, the relatively high renal radiotracer uptake was masked using a thresholding method. Arrows demonstrate tumor, where indicated. Images are scaled to the same maximum value within each modality.