
Fig. 6. The number of CD19-tPSMA(N9del) cells in the peripheral blood and the bone marrow does not correlate with the total number of the CD19-tPSMA(N9del) cells localized to the tumors.
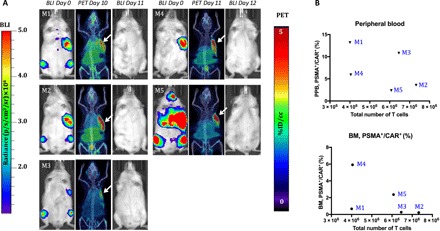
(A) PET/CT and BLI images of five mice. Days are marked from the day of infusion of CD19-tPSMA(N9del) CAR T cells. Mice were imaged on the SuperArgus small-animal PET/CT at 1 hour after injection of 14.8 MBq of [18F]DCFPyL and were scanned at various times after injection, as indicated. Images alternate between fLuc-tagged bioluminescence (BLI, radiance) for visualization of tumor cells and PET/CT for CAR T cells, with each mouse undergoing both imaging studies. PET data are expressed in percentage of injected dose per cubic centimeter of tissue imaged (%ID/cc), with arrows designating accumulation of CAR T cells. To improve the display contrast of the in vivo images, the relatively high renal radiotracer uptake was masked using a thresholding method. Images are scaled to the same maximum value within each modality. (B) Quantified numbers of the CD19-tPSMA(N9del) cells in the region of interest drawn to cover the entire tumor area were plotted with the percentage number of PSMA+/CAR+ cell populations in the peripheral blood (PPB) and the bone marrow (BM). Each data point (M) represents each mouse; n = 5.