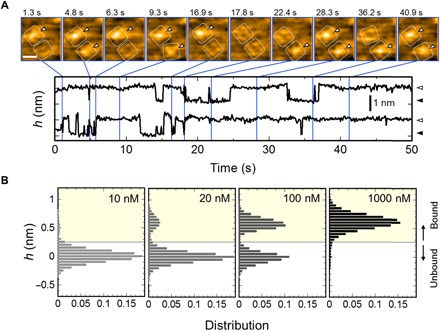
Fig. 2. HS-AFM captured AgTx2 binding to the channel with single-molecule resolution.

(A) Time-lapse images of AgTx2 binding to and dissociation from the KcsA channels (top; see also movie S1) and time courses of the averaged height h (nm) around the center of the extracellular surface (0.8 nm by 0.8 nm area) of two corresponding K+ channels (bottom). White dotted squares represent regions of interest for visualization of the tetrameric channels. Spontaneous AgTx2 bindings on the channels are indicated by white arrowheads (top). These two channels showed discrete changes in the h (nm), representing bound and unbound states of the channels (bottom). The bathing electrolyte solution contains 10 mM Hepes (pH 7.5) and 100 mM KCl. The scale bar in the first AFM image represents 5 nm. (B) Height histograms at 10, 20, 100, and 1000 nM AgTx2. The height of the extracellular surface of the AgTx2-unbound channel was set to 0 nm. Height transitions used in the histograms were measured in 10 mM Hepes (pH 7.5) containing 200 mM KCl. The number of data frames used for the histograms were 8604, 250,846, 33,701 and 35,453 for 10, 20, 100, and 1000 nM AgTx2, respectively.
