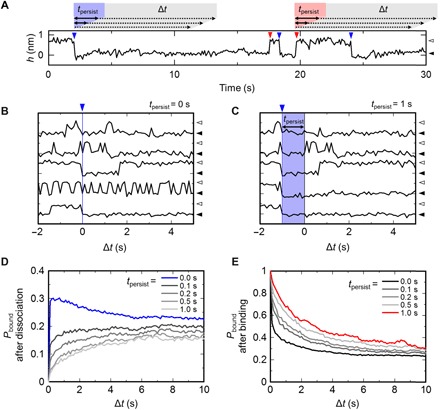
Fig. 3. Event-oriented analysis of AgTx2 binding.

(A) Representative data of height transitions and definitions for the event-oriented analysis. The AgTx2-bound and AgTx2-unbound states are indicated by white and black arrowheads, respectively. Red and blue arrowheads indicate binding and dissociation events, respectively. For an arbitrary dissociation event (blue arrowhead), tpersist was defined from the instance of dissociation (blue). The time origin of Δt was the end of tpersist. The time variable definitions are the same as for the binding event (red arrowhead). (B and C) A representative dataset and the event-oriented analysis. The AgTx2-bound and AgTx2-unbound states are indicated by white and black arrowheads, respectively. All dissociation events were detected from the long-lasting height transition data, and strips of data before and after the event were collected and aligned at the dissociation events (Δt = 0) (blue arrowhead). Five examples are shown. For tpersist = 0 s (B), all the strips were ensemble-averaged, providing Pbound(Δt) for tpersist = 0 s. For tpersist = 1 s (C), strips of data persisting in the unbound state longer than tpersist after the dissociation event were used for ensemble averaging. (D) Time course of the binding probability after dissociation. Pbound(Δt) for different tpersist values ranging from immediately after dissociation (tpersist = 0 s) to 1 s from dissociation (tpersist = 1 s) are shown as a function of Δt measured from the end of tpersist. As tpersist increased, the time course of Pbound(Δt) could be expressed by a single-exponential function. (E) Time course of the binding probability after binding. Pbound(Δt) for different tpersist values from immediately after binding (tpersist = 0 s) to 1 s (tpersist = 1 s) after binding are shown. The binding transitions were measured in 10 mM Hepes (pH 7.5) containing 200 mM KCl and 20 nM AgTx2.
