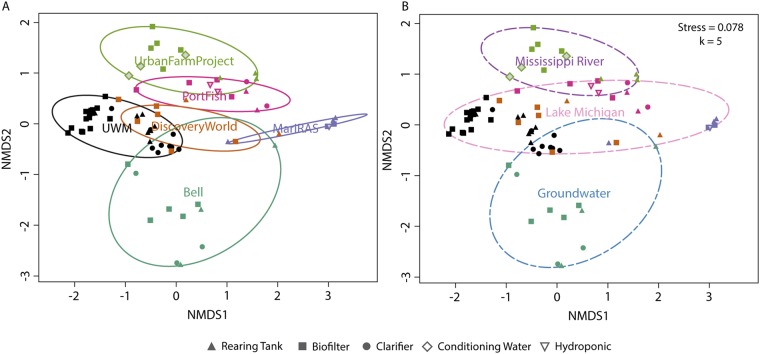
FIG 2.
Nonmetric multidimensional scaling (nMDS) plot of bacterial community composition. The plot indicates Bray-Curtis dissimilarity between samples (V4-V5 16S rRNA gene data) as ordinated by the metaMDS function with dimensions k = 5 and stress = 0.078. Data in ellipses are illustrated as follows: (A) all samples from a particular site (ADONIS R2 = 0.355, P ≤ 0.001) and (B) all samples from a particular water source (ADONIS R2 = 0.110, P ≤ 0.001). Ellipses were added with the ordiellipse function in vegan (70). The component origin of each sample is indicated via the shape of the sample point as indicated in the figure key. UWM, University of Wisconsin—Milwaukee.

