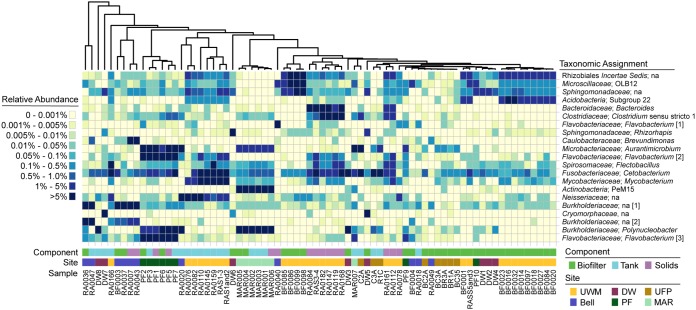
FIG 3.
Heat map of the most abundant 16S rRNA gene amplicon sequence variants across component types. The plot indicates bacterial community composition relative to abundance data ordered by distance-based clustering (Euclidian) of samples containing only the illustrated amplicon sequence variants (ASVs). The top 10 most abundant ASVs (mean relative abundances) for each major component type, biofilter, solids, and rearing tank are plotted (heatmap2 from the ggplots R package). The ASVs are also ordered by distance-based clustering (Euclidian) of their relative abundance patterns. Gene relative abundances are indicated via color-coding as listed in the plot key. Each sample’s component type and sample site origin are indicated below the heat map. The sample name abbreviations are as follows: Bell, Bell Aquaculture; DW, Discovery World; PF, PortFish; UFP, UrbanFarmProject; MAR, Marinette. Family-level and genus-level taxonomic assignments are listed for each ASV. When these levels were not assigned, then the most refined taxonomic level is provided. Identical taxonomic assignments are given a number (indicated in square brackets) to facilitate references in the text. na, unassigned taxonomy at this level.

