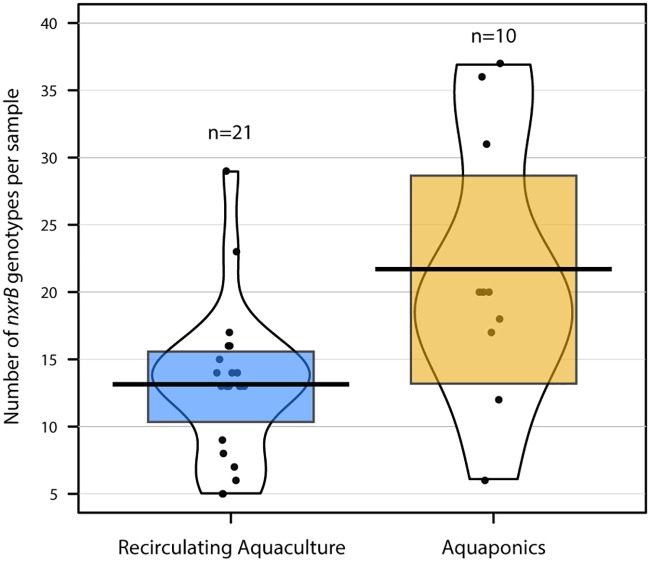
FIG 5.
Richness distribution for recovered nxrB genotypes between RAS and aquaponic samples. Pirate plots (“yarrr” package in R) are indicated for nxrB genotype richness for each sample class (aquaponic or RAS). A black line indicates the richness mean, a colored box indicates the Bayesian highest-density interval, and all points are listed with corresponding indication of data distribution/density via figure shape.

