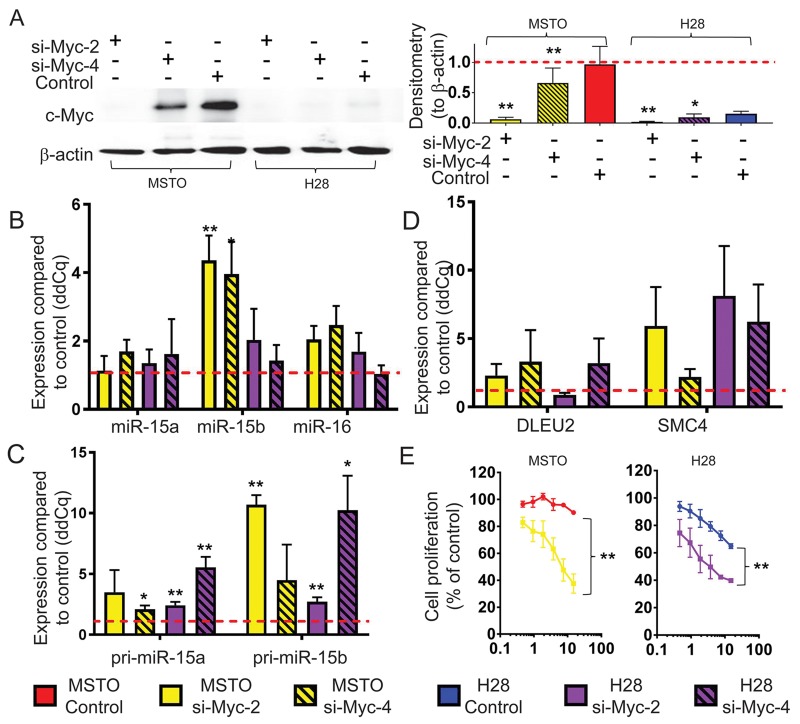
Figure 4. Myc knockdown causes an upregulation of mature miR-15b/16-2 expression and its processing intermediates and inhibits cell growth.
(A) Myc protein expression in MPM cell lines with high (MSTO) and low (H28) basal expression 48 h post transfection with Myc siRNAs (si-Myc-2 and si-Myc-4) and control (all at 20 nM). β-actin expression was included as a loading control. Densitometry was used to quantify Myc protein expression from 3 independent experiments that were normalized to β-actin. Data are mean ±SD. RT-qPCR was used to measure (B) Mature miRNA, (C) pri-miRNA and (D) host gene mRNA expression levels following transfection with Myc siRNA (si-Myc-2, si-Myc-4) or control transfection. RNU6B was used as a reference gene for miRNA expression while 18s was used as reference for pri-miRNA and host-gene expression. Data is the mean from 3 separate experiments ±SD. (E) Cell proliferation was measured 96 h after transfection with si-Myc-2 or control at the indicated concentrations. Cell proliferation is represented as % of untransfected cells. Data is expressed as the mean ±SEM of 3 independent experiments performed in duplicate. * = p ≤ 0.05; ** = p ≤ 0.01.

