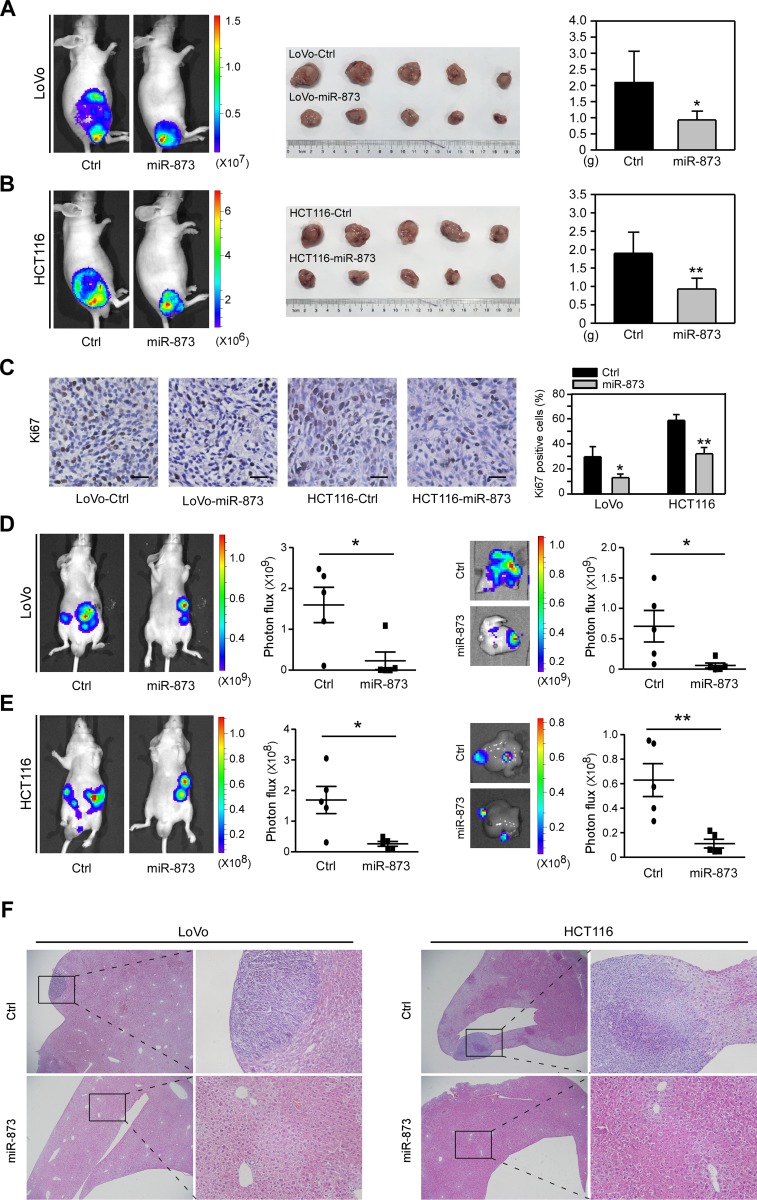
Figure 4. MiR-873 suppresses CRC cell growth and liver metastasis in vivo.
(A) Images of bioluminescence of mice that was subcutaneously injected with LoVo-control and LoVo-miR-873 cells (left). Image (middle) and weight quantification (right) of subcutaneous tumors formed by LoVo-control and LoVo-miR-873 cells. (B) Images of bioluminescence of mice that was subcutaneously injected with HCT116-control and HCT116-miR-873 cells (left). Image (middle) and weight quantification (right) of subcutaneous tumors formed by HCT116-control and HCT116-miR-873 cells. (C) Representative images of IHC staining and quantification of Ki67-positve cells rate in tumors formed by LoVo/HCT116-control and LoVo/HCT116-miR-873 cells. (D) Images and quantification of bioluminescence imaging of mice (left) and livers (right) intrasplenically injected with LoVo-control and LoVo-miR-873 cells. (E) Images and quantification of bioluminescence imaging of mice (left) and livers (right) intrasplenically injected with HCT116-control and HCT116-miR-873 cells. Scale bars, 100 μm. (F) H&E of livers intrasplenically injected with LoVo-control and LoVo-miR-873 cells or HCT116-control and HCT116-miR-873 cells. Original magnification, ×40 (left of each cell), ×200 (close-up, right of each cell) *P < 0.05; **P < 0.01.

