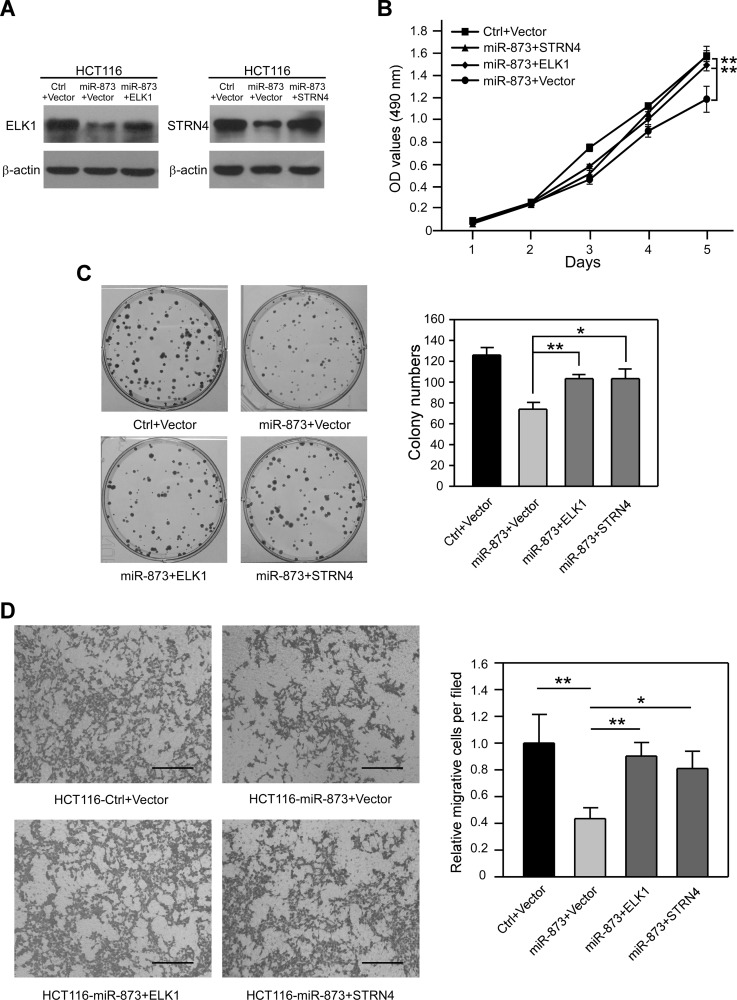
Figure 6. Re-activation of ELK1 and STRN4 can partially rescue phenotypes restrained by miR-873.
(A) Western blotting analysis of ELK1 and STRN4 protein levels in HCT116-control and HCT116-miR-873 cells re-expressing ELK1 or STRN4. (B) MTT assays of HCT116-control and HCT116-miR-873 cells re-expressing ELK1 or STRN4. (C) Representative images and quantification of colonies formed by HCT116-control and HCT116-miR-873 cells re-expressing ELK1 or STRN4. (D) Representative images and quantification of cell migration and invasion assays of HCT116-control and HCT116-miR-873 cells re-expressing ELK1 or STRN4. Data (mean ± SEM) are representative of 3 technique replicates. Scale bars, 100 μm. *P < 0.05; **P < 0.01.

