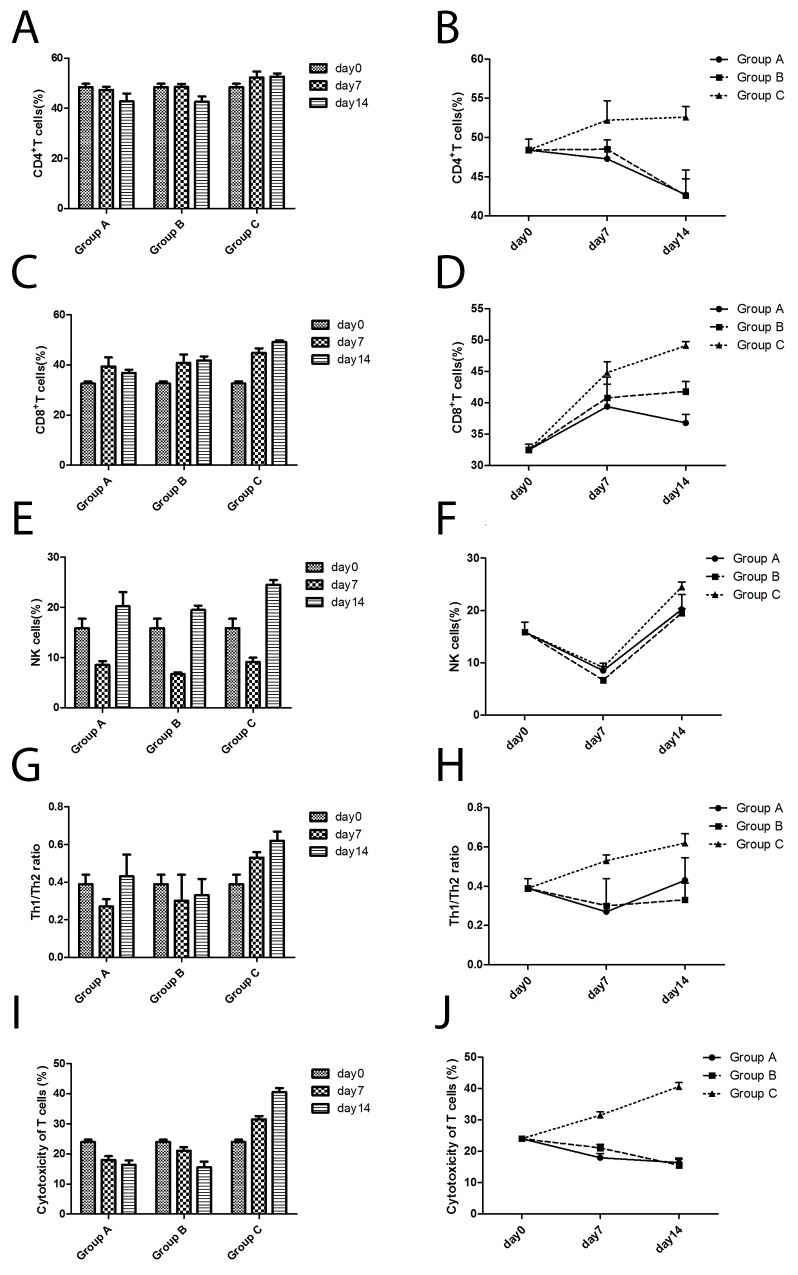
Figure 4. The changes in immune cells according to flow cytometric analyses of cells from three groups.
(A) The CD4+ T cell numbers changed with time. (B) The differences in CD4+ T cell numbers among the three groups. (C) The CD8+ T cell numbers changed with time. (D) The differences in CD8+ T cell numbers among the three groups. (E) The NK cell numbers changed with time. (F) The differences in NK cell numbers among the three groups. (G) The Th1/Th2 ratio changed with time. (H) The differences in Th1/Th2 ratios among the three groups. (I) The cytotoxicity of T cells changed with time. (J) The differences in cytotoxicity of T cells among the three groups.

