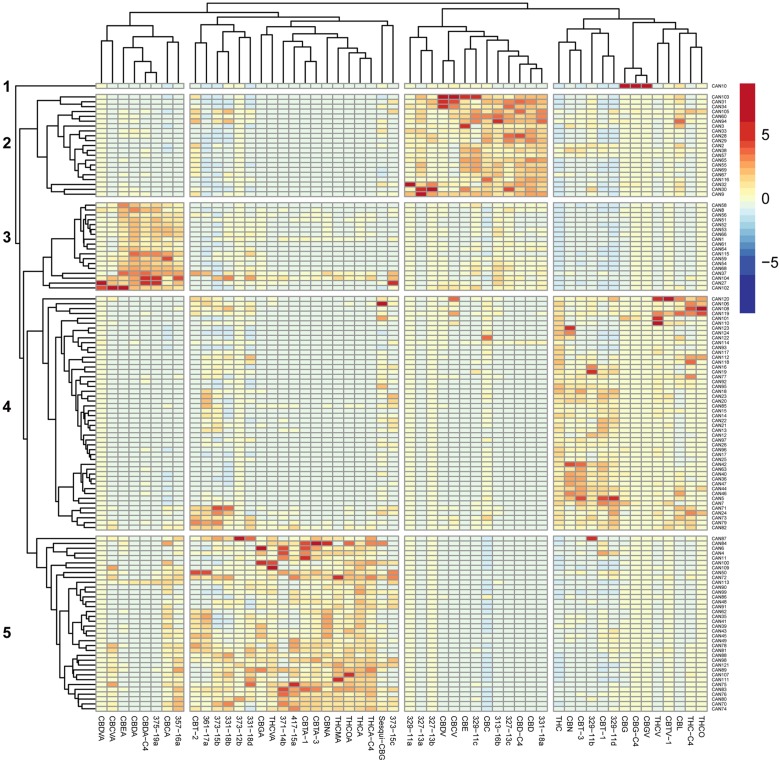
Figure 1. Heat map of unsupervised hierarchical clustering of the cannabinoid profile of 124 Cannabis extracts.
The matrix of the ESI-LC/MS phytocannabinoid analysis Z-scores representing the set of associations was scaled by column to range from -8 to 8. Negative values (dark blue) indicate that the extract contained very low levels of the phytocannabinoid, and positive values (red) indicate that this extract was composed of high levels of the phytocannabinoid. Dendrograms indicating the clustering relationships are shown to the left and above the heat map. The 124 extracts segregate into five major clusters comprised of phytocannabinoids that associate with: (1) larger amounts of CBG-type; (2) larger amounts of CBD-type.; (3) larger amounts of CBDA-type; (4) larger amounts of Δ9-THC-type; (5) larger amounts of Δ9-THCA-type.

