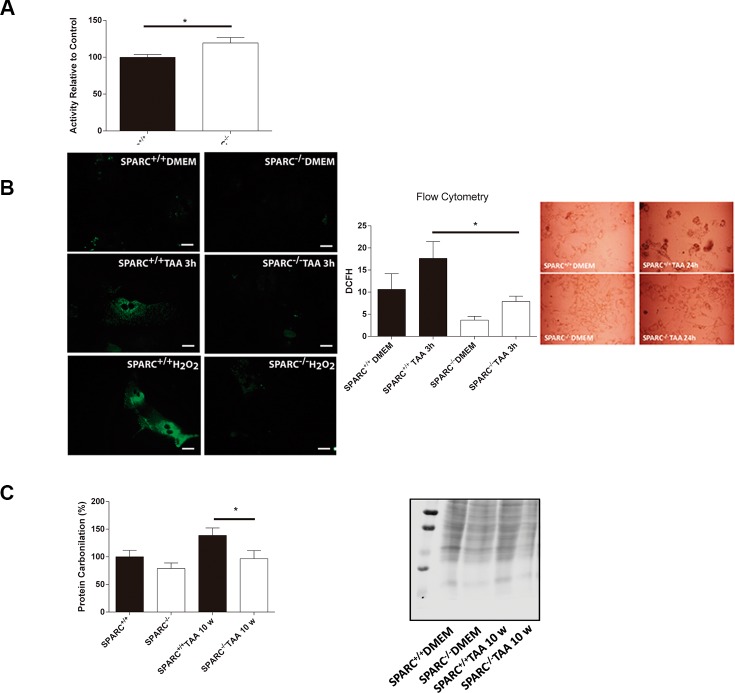
Figure 3. Endogenous reactive oxygen species production in response to TAA treatment.
(A) Catalase activity of livers from SPARC−/− (n = 6) and SPARC+/+ (n = 7) mice relative to controls. *p < 0.05, Mann-Whitney test. (B) Representative microphotographs of hepatocytes treated with TAA or H2O2 for 3 hours (400×, bar 25 μm) (left panel); 2′,7′-dichlorofluorescin diacetate assay for flow cytometric measurement of reactive oxygen species of hepatocytes treated with TAA for 3 hours. *p < 0.05. Mann-Whitney test, n = 4; photomicrographs of primary culture hepatocytes TAA-treated from SPARC+/+ and SPARC−/− mice (400×, inset); (C) Carbonylation levels of liver total proteins from SPARC+/+ and SPARC−/− mice TAA-treated for 10 weeks n = 4.

