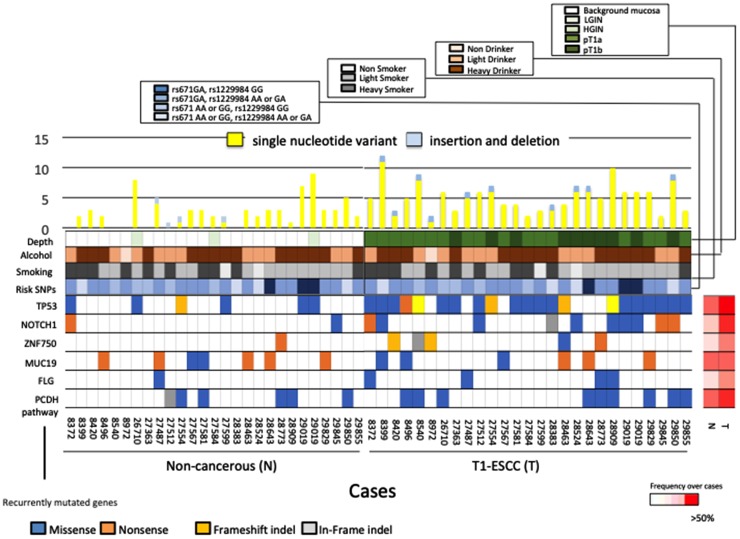
Figure 2. Mutational landscapes in carcinoma tissues and non-cancerous tissues of 26 ESCC patients.
(Upper panel) The number of somatic mutations per sample. Yellow bars indicate the number of single nucleotide variants and blue bars indicate the number of indels. (Lower panel) Genes were mutated in > 3 patients with a mutation rate of > 10 mutation/Mb. The panel shows mutated type of these 6 genes, history of alcohol and smoking, risk SNPs, and tumor depth. The right panel shows non-cancerous tissues information, and left panel shows cancerous tissues information. The heat map on the right indicates the frequency of each mutated gene in non-cancerous tissue and ESCC over all cases.

