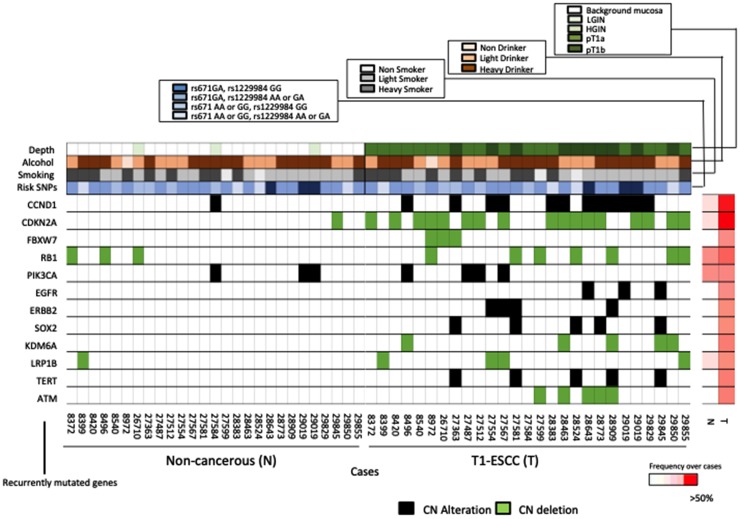
Figure 3. Comparison of the key alterations in non-cancerous tissues and ESCCs.
Plots showing the amplification of oncogenes (red) and deletion of tumor suppressor genes (blue) in non-cancerous tissues (left), and ESCCs (right). The heat map on the right indicates the frequency of each mutated gene in non-cancerous tissue and ESCC over all cases.

