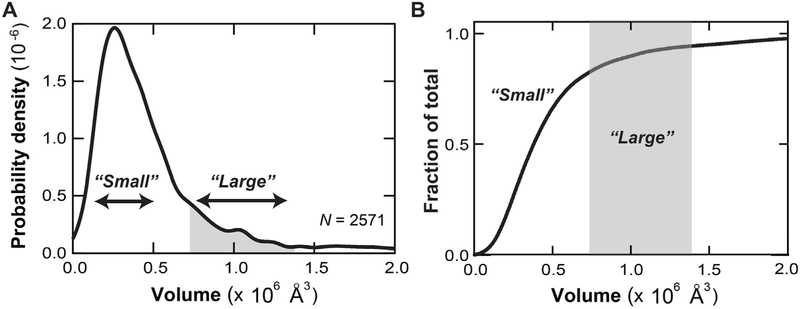
Fig. 3.
AFM protrusion volume analysis of Pgp reconsituted in liposomes. (A) Histogram showing the distribution of volumes of Pgp protrusions. N is the number of features that were measured. (B) A normalized plot of the fraction of a given feature versus the volume. In both panels, the regions corresponding to the “small” and “large” protrusions are labeled; the “large” are colored gray.

