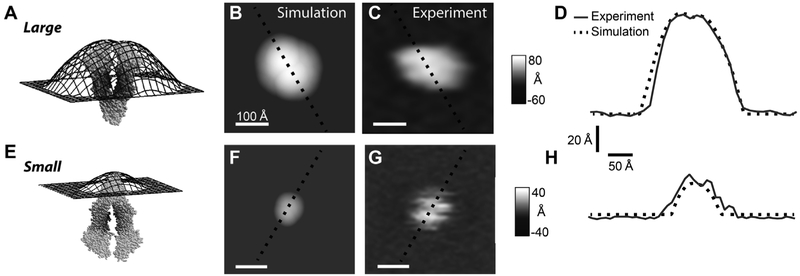
Fig. 4.
Simulated versus experimental AFM images of Pgp. The 4M1M Pgp X-ray crystal structure (light gray van der Waals surface) and the simulated topographic surface (black) produced of the (A) C and (E) EC domains of Pgp using membrane positioning by OPM algorithm. Simulated AFM gray scale images of the (B) C and (F) EC domains are colored according to the protrusion height of the topographical surfaces shown in panels A and E, respectively. A representative (C) “large” and (G) “small” protrusion feature in the experimental AFM images. The white horizontal scale bar indicates 100 Å. Cross-sections of the (D) C-side simulated AFM image versus the “large” experimental AFM feature and (H) EC-side simulated AFM image versus the “small” AFM feature. The simulated and experimental cross-sections are shown as dashed black lines and gray lines, respectively. The lines in these panels correspond to the black dashed lines shown in the simulated and experimental contour plots of panels B, C, F and G.

