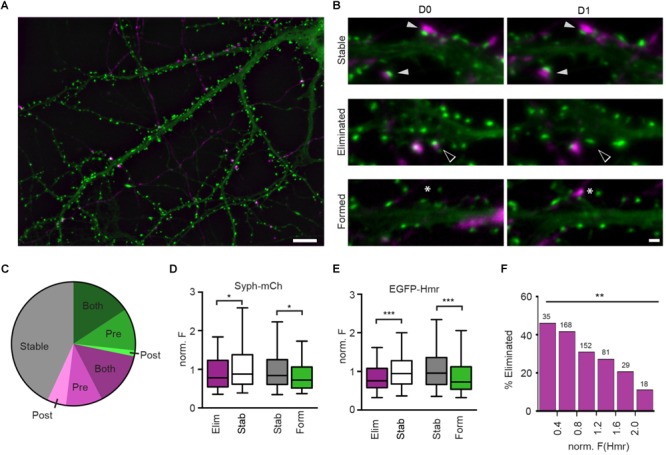
FIGURE 1.

Structural plasticity of synapses in hippocampal culture. (A) Overview image of Syph-mCh-expressing presynaptic neurons (magenta) and EGFP-Hmr-expressing postsynaptic neurons (green). Scale bar: 10 μm. (B) Micrographs of stable (filled arrowheads), eliminated (open arrowheads) and formed synapses (asterisks). Scale bar: 1 μm. (C) Fractions of stable (gray), eliminated (magenta) and formed synapses (green). Shades of green and magenta indicate whether only presynaptic (Pre), post-synaptic (Post) or pre-and post-synaptic compartment (Both) exhibited structural plasticity leading to synapse gain or loss. (D) Normalized Syph-mCh fluorescence intensities of eliminated synapses (median 0.78) were significantly lower than those of stable synapses (median 0.88; Mann-Whitney U-test: U = 22683, p = 0.019). Similarly, newly formed synapses (median 0.72) had less Syph-mCh than stable synapses (median 0.84; U = 18243, p = 0.012). (E) Normalized EGFP-Hmr fluorescence intensities of eliminated synapses were significantly lower than those of stable synapses (Mann-Whitney U-test: U = 20788, p = 0.0003). Similarly, newly formed synapses had less EGFP-Hmr than stable synapses (U = 16396, p < 0.0001). For D,E, the dataset contained n = 320 stable synapses, n = 163 eliminated synapses and n = 134 formed synapses. (F) Binning of data from d shows that synapses with little EGFP-Hmr accumulation and putatively small PSDs are frequently eliminated whereas synapses with large EGFP-Hmr clusters, indicative of large PSDs, are much more likely retained [Chi-square test: X2(df = 5, n = 483) = 15.41, p = 0.0088]. Numbers above bars show the number synapses analyzed for each bin. ∗p < 0.05, ∗∗p < 0.01, ∗∗∗p < 0.001.
