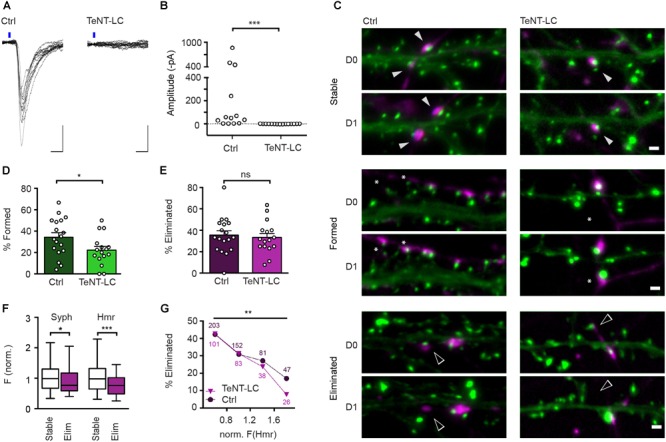
FIGURE 5.

TeNT-LC expression has no effect on synapse elimination but significantly reduces formation. (A) Neurons were transfected with a plasmid encoding oCHIEF and either a plasmid with cDNAs encoding TeNT-LC and Syph-mCh, or a plasmid only encoding Syph-mCh (control). Two days following transfection, transfected neurons were identified and nearby untransfected neurons were recorded in whole-cell voltage clamp. Shown are responses to optogenetic stimulation in neurons from controland TeNT-LC-transfected cultures. Scale bars: 10 ms, 100 pA. (B) In recordings from 15 neurons in TeNT-LC-transfected cultures, optogenetics stimulation failed to induce any responses. In contrast, optogenetics stimulation elicited reliable post-synaptic currents in the majority of 13 control cultures (Mann Whitney U test: U = 184.5; p < 0.001). (C) Example micrographs of stable (filled arrowheads), eliminated (open arrowheads) and formed synapses (asterisks) in control and TeNT-expressing groups. Scale bar = 1 μm. (D) The fraction of synapses formed by neurons expressing TeNT-LC (22.1 ± 3.5%, n = 16) was significantly lower than that of control neurons (34.3 ± 4.2%, n = 18; unpaired Student’s t-test: t(32) = 2.19, p = 0.036). (E) The fraction of eliminated synapses made by neurons expressing TeNT-LC (33.3 ± 3.8%) was indistinguishable from the that of control neurons 35.5 ± 4.0; t(32) = 0.39, p = 0.696, Student’s t-test). Data are shown as mean ± SEM. (F) Comparison of Syph-mCh and EGFP-Hmr fluorescence intensities at stable (n = 168, white box plots) and eliminated synapses (n = 80, purple box plots) from TeNT-LC expressing neurons. Eliminated synapses had lower normalized fluorescence intensities for Syph-mCh and EGFP-Hmr (median of 0.77 and 0.76, respectively) than their stable counterparts (0.99 and 0.98). These differences were significant for Syph-mCh (Mann–Whitney U test: U = 5577, p = 0.0303) and EGFP-Hmr (U = 4784, p = 0.0002). (G) Synapses were binned according to EGFP-Hmr fluorescence as a measure of synapse size and the fraction of eliminated synapses determined in each size bin. The fraction of eliminated synapses made by TeNT-LC-expressing neurons decreased with increased synapse size [Chi square test: X2(3, n = 248) = 13.4, p = 0.0038]. This decrease paralleled the decrease of the elimination rate seen in synapses from control neurons re-binned dataset from Figure 1; X2(3, n = 483) = 14.47, p = 0.0021). There was no significant difference in the rate of elimination between control and TeNT-LC-silenced synapses (Log-linear analysis: G2(4, n = 731) = 1.50, p = 0.83). Data labels indicate numbers of synapses contained in each bin for TeNT-LC-silenced synapses (triangles) and Ctrl synapses (circles). ∗p < 0.05, ∗∗p < 0.01, ∗∗∗p < 0.001.
