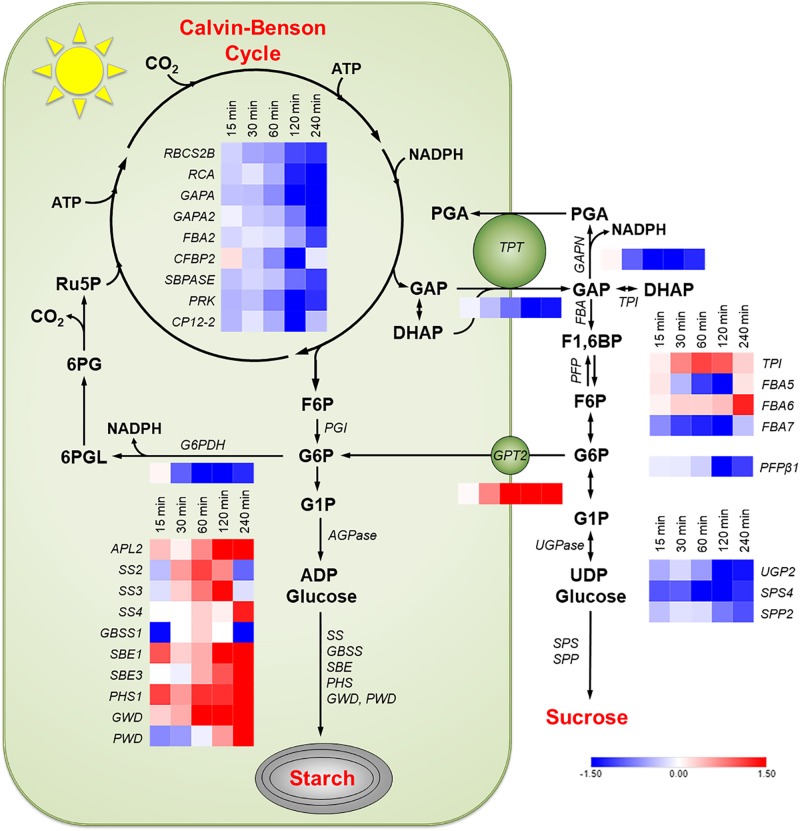
FIGURE 4.
Changes in transcription in Col-0 in response to an increase in PFD from 120 to 500 μmol m–2 s–1. Transcripts of the following pathways or genes are shown: Calvin-Benson cycle, starch synthesis, sucrose synthesis, the G6P shunt, the non-phosphorylating GAPDH (GAPN) in the cytosol, the glucose-6-phosphate transporter (GPT2), and the triose phosphate transporter (TPT). Red boxes represent an increase in transcription and blue a decrease. Expression values shown had a log2 RPKM fold change greater than one and are on an absolute scale of –1.5 to 1.5. n = 3.

