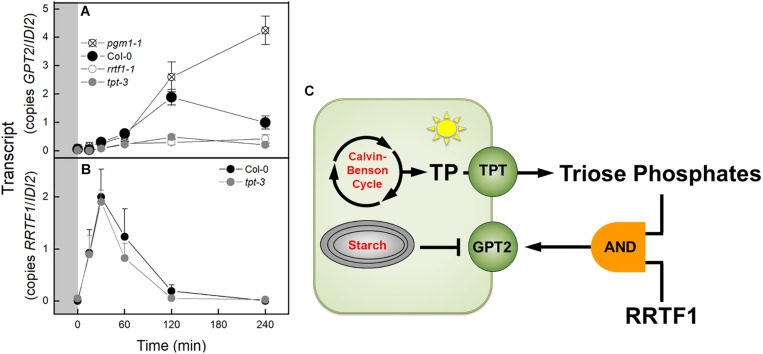
FIGURE 7.
Expression of GPT2 and RRTF1 in response to an increase in PFD from 120 to 500 μmol m–2 s–1 Ca 400 ppm in Col-0 and mutants and model of transcriptional regulation of GPT2. (A) qPCR data of expression of GPT2 in Col-0 and pgm1-1, rrtf1-1, and tpt-3 mutants. n = 5 (B) qPCR data of expression of RRTF1 in Col-0 and tpt-3 mutant. n = 5 (C) Model of transcriptional regulation of GPT2 expression. Triose phosphates in the cytosol and RRTF1 are both required for expression of GPT2 (shown as an “AND” logic gate) while starch synthesis represses GPT2 expression.

