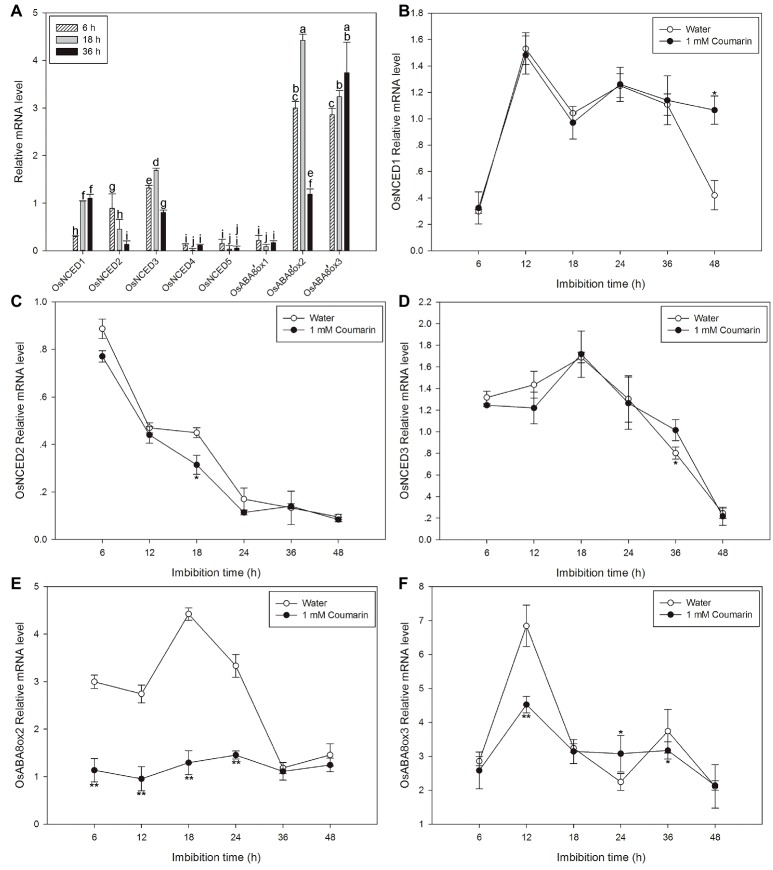
Figure 6.
Changes in the expression profiles for OsNCED and OsABA8’ox genes during rice seed germination as assessed with qPCR. (A) The expression levels of OsNCED1–5 and OsABA8’ox1–3 in embryos assayed by qPCR after their seeds had been imbibed in water for 6, 18, or 36 h. Data represent the mean ± SE of three biological replicates, each with 30 embryos (0.1 g per replicate). Expression patterns for OsNCED1 (B), OsNCED2 (C), OsNCED3 (D), OsABA8’ox2 (E), and OsABA8’ox3 (F) in embryos as assayed by qPCR after seed imbibition of water or 1 mM coumarin at 6, 12, 18, 24, 36, and 48 h. Data represent the mean ± SE of three biological replicates, each with 30 embryos (0.1 g per replicate). Means denoted by the same letter did not significantly differ at p < 0.05 according to Fisher’s least significant difference test (A). Significant differences in the data of relative mRNA level in 1 mM coumarin from those in water at each imbibition time point were assessed by Student’s t test (B–F, *p < 0.05; **p < 0.01).

