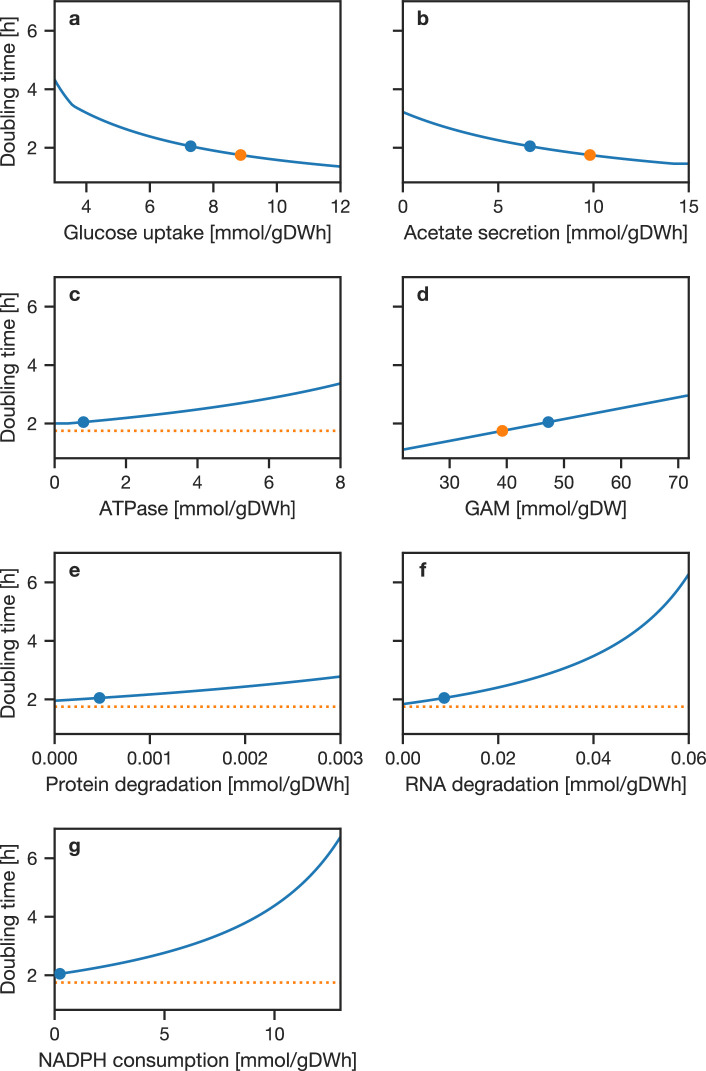
Appendix 1—figure 2. Sensitivity analysis of model doubling time with respect to model constraints.
In each panel, the stated parameter was varied over the indicated range and the model doubling time calculated while keeping all other constraints constant. (A:) Maximal glucose uptake. (B:) Maximal acetate secretion. (C:) ATPase ATP cost. D: GAM ATP cost. (E:) Protein degradation rate. (F:) RNA degradation rate. (G:) Imposed NADPH consumption. The blue circle marks the value used in the FBA model and resulting doubling time; the orange circle indicates the parameter that would yield the experimental doubling time. If there is no value of the parameter which would yield the experimental doubling time, a horizontal line is plotted.

