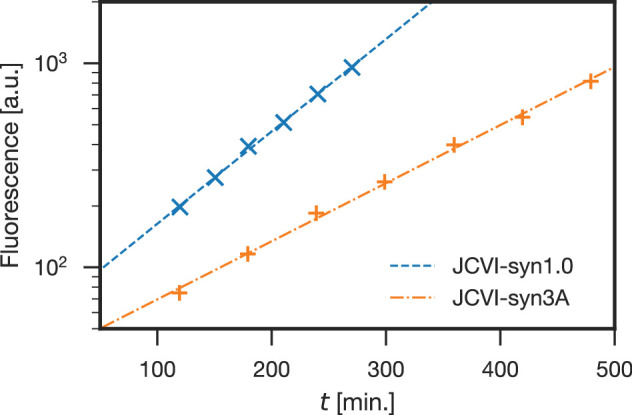
Figure 14. Comparison of growth curves of JCVI-syn1.0 and JCVI-syn3A.

JCVI-syn1.0 has a doubling time of 66 min (blue; ‘×' markers), whereas JCVI-syn3A has a doubling time of 105 min (orange; ‘+' markers). Doubling times () were calculated as described in Section 'Materials and methods', plotting fluorescence staining of cellular DNA vs. time, fitted by exponential regression curves. The regression curves for JCVI-syn1.0 and JCVI-syn3A have values of 0.9986 and 0.9976, respectively.
