. 2019 Jan 18;8:e36842. doi: 10.7554/eLife.36842

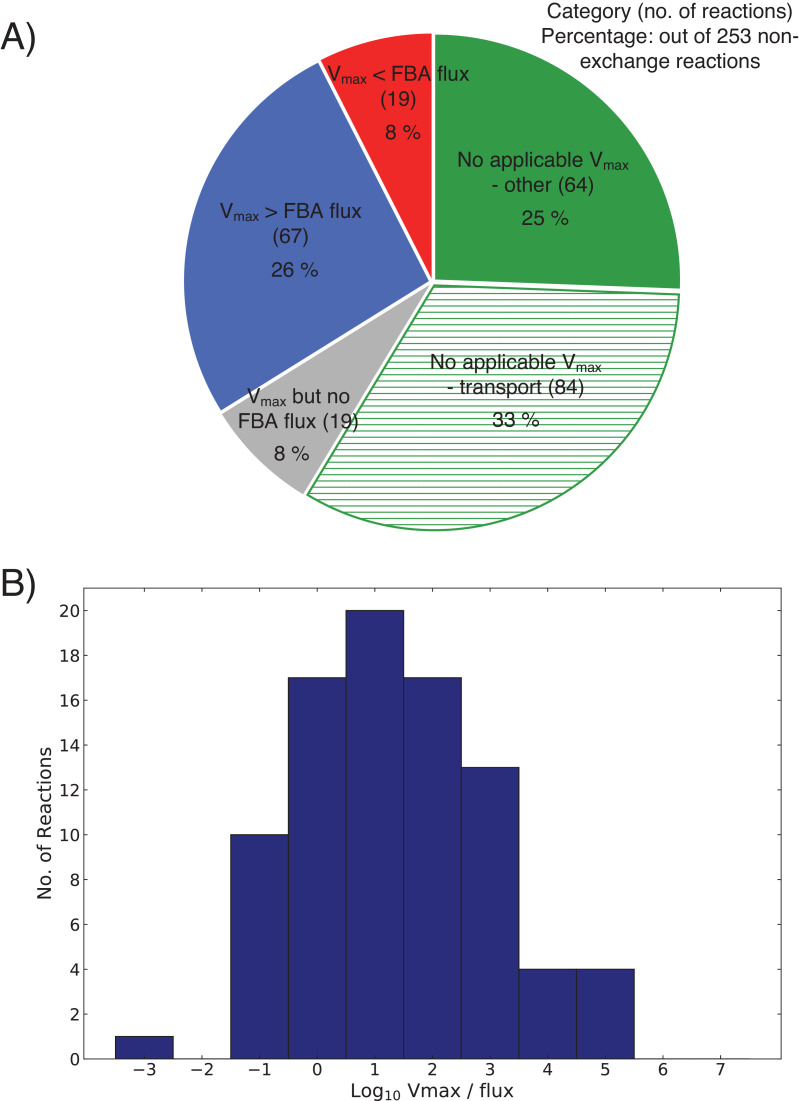
Figure 15. Comparison of FBA steady-state fluxes ν to maximal fluxes Vmax obtained from protein abundances and turnover numbers from BRENDA and the literature.

Map components and labels as in Figure 5, with reaction highlighting and gene loci/gene-protein-reaction rules omitted. Each edge is colored according to the ratio between Vmax and ν: Blue indicates Vmax>ν, red indicates Vmax<ν and green indicates that no Vmax could be obtained (because of either missing turnover number or missing protein abundance; or because reaction is not enzymatic to begin with).

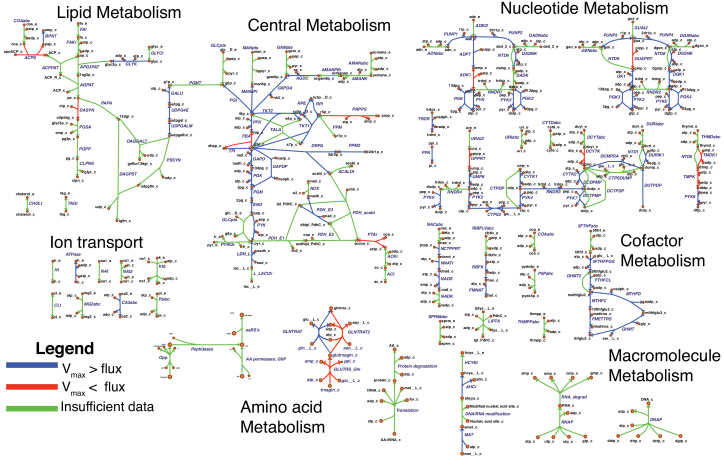
Figure 15.

Figure 15—figure supplement 1. Statistics of FBA steady-state fluxes ν vs. maximal fluxes Vmax comparison (see Figure 15).

Figure 15—figure supplement 1.

(A) Summary of Vmax vs. ν comparison over all 253 non-exchange reactions in the model. Red, blue, green: Meaning as in Figure 15. Green-striped: Subset of green set—reactions without Vmax that pertain to transport, which usually do not have an EC number associated with them. Gray: Reactions with ν=0 in the FBA solution (thus Vmax>ν always fulfilled). B: Histogram of Vmax/ν over the blue and red subset in panel A.