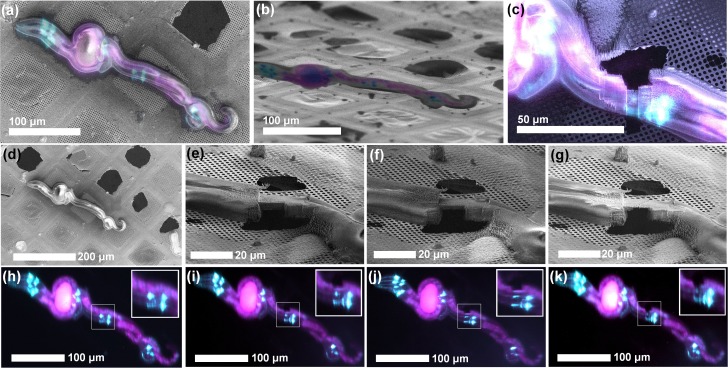
Figure 5. ROI identification, targeting and cryo-lamella preparation in C. elegans larvae.
(a) Correlation between the SEM (top view) and fluorescence microscopy images. (b) Correlation between the FIB and fluorescence microscopy images. The sample is tilted into the lamella preparation position (22° with respect to the grid plane). (c) SEM image of the thinned down lamella overlayed with the fluorescence image from the same region. (d,h) SEM and optical images, respectively, of the initial state of the sample, while the pairs (e, i), (f, j) and (g, k) show SEM and optical images, respectively, of the intermediate steps in the lamella, thinning. Since the optical microscope is integrated within the system, multiple ROI-verifications are possible throughout the workflow without the need for cryo-transfers.

