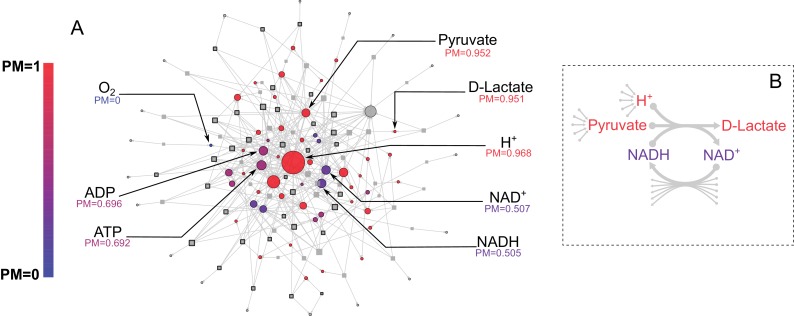
Figure 2. E. coli core metabolic network metabolite producibility.
(A) The E. coli core metabolic network is represented as a bipartite graph with metabolites shown as circles and reactions shown as squares. Reactions shown with a black border are irreversible in the model, those with no border are reversible. All intracellular metabolites are colored based on their PM value (low – blue, high – red). Reactions and metabolite nodes are sized based on their total node degree. Several key metabolites of interest are highlighted with their corresponding PM values shown. Central metabolites such as H+ and Pyruvate have high degree and high PM. Cofactors such as AMP/ADP/ATP and NAD+/NADH have high degree but low PM, as they cannot be synthesized in this network. Oxygen is an example of a PM=0 metabolite that cannot be produced from any other metabolites in this network. D-lactate is an example of a metabolite with low degree and high PM that is it is easily produced but not well-connected. (B) The lactate dehydrogenase reaction producing D-Lactate is shown as an example to illustrate that poorly connected metabolites can display a high PM, and how recycled cofactors have minimal impact on PM values. Lactate dehydrogenase produces D-lactate and NAD+ from pyruvate, H+ and NADH. The metabolite D-lactate has high PM despite being produced only by this one reaction in the metabolic network because it can be produced from the high PM metabolites pyruvate and H+, which are themselves produced from a large number of possible precursors. Although NADH is also used to produce D-lactate, and has a relatively low PM in this core model, it has minimal impact on the PM of D-lactate as NADH can be recycled from NAD+ by a large number of reactions (represented by the arrows at the bottom of the figure) and thus production of NADH is not necessary for the production of D-lactate.


