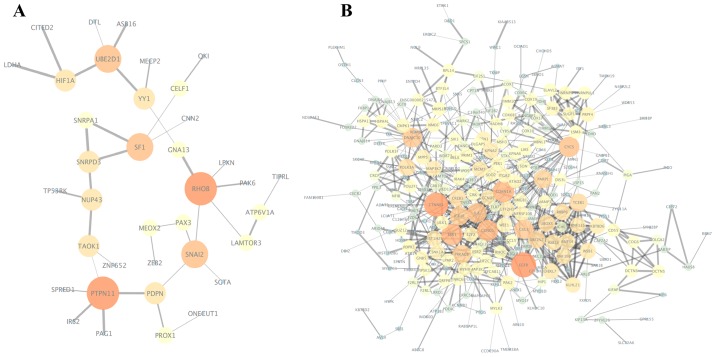
Figure 5.
(A) Protein-protein interaction (PPI) network of the target genes of the top 3 most highly upregulated differentially expressed miRNAs (DEMs). (B) PPI network of the target genes of the top 3 most highly downregulated DEMs. Node size indicates the connectivity degree, and larger circles indicate a higher degree. Edge size indicates the combined scores between genes, which represent the confidence of protein interactions. The color gradually increases from dark (blue) to bright (red), representing the gradually increase in the number of interacting genes.

