Figure 6.

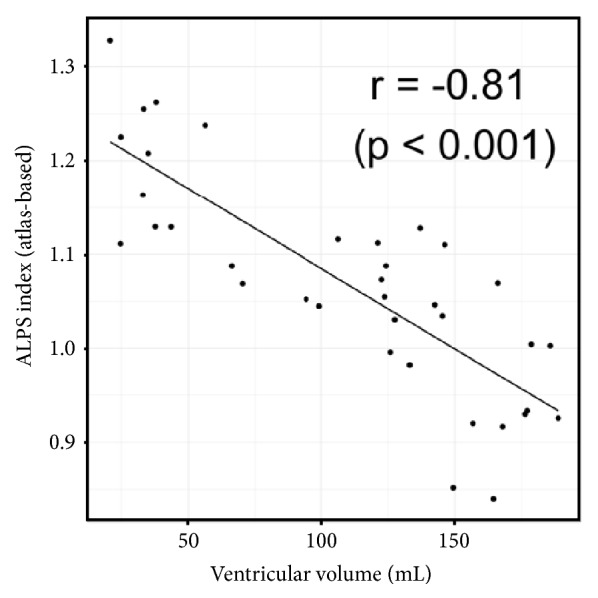
Scatter plot shows correlation between atlas-based ALPS index and supratentorial ventricular volume. There was strong correlation between them (r = -0.81, p < 0.001).

Scatter plot shows correlation between atlas-based ALPS index and supratentorial ventricular volume. There was strong correlation between them (r = -0.81, p < 0.001).