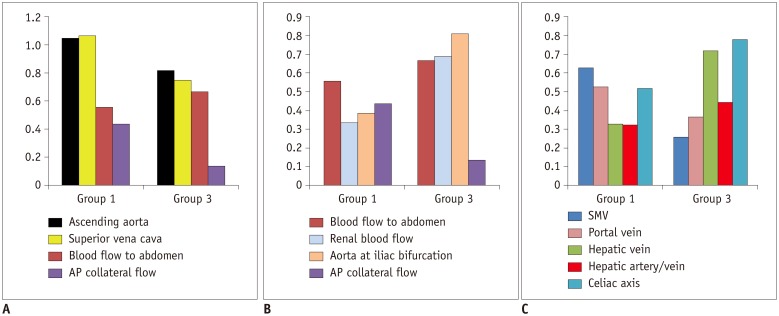
Fig. 4. Graphs showing blood flow distribution in patient groups in comparison with healthy controls.
Y axis represents ratios between mean values of blood flow volumes in patient groups and healthy controls, except for ratio between hepatic arterial and venous flows (hepatic artery/vein) and AP collateral flow. Y axis for AP collateral flow indicates contribution of AP collateral flow to total pulmonary venous return. AP= aortopulmonary

