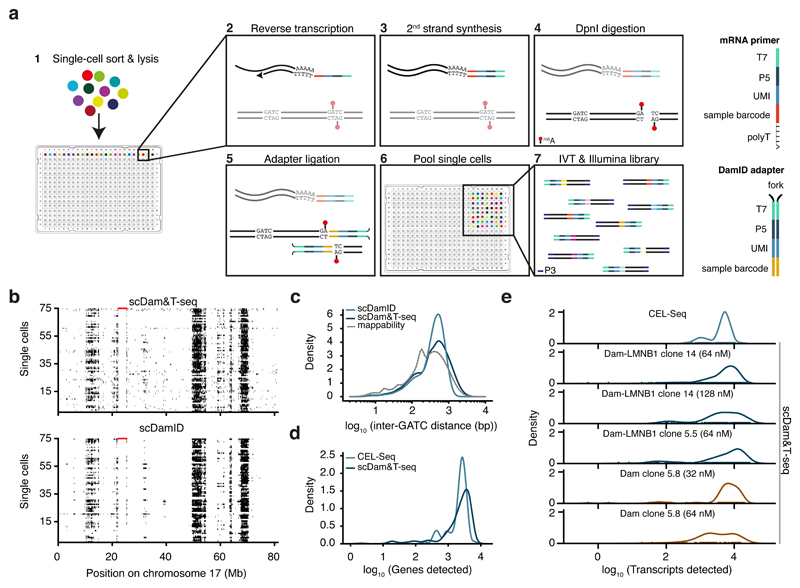
Figure 1. Quantitative comparison of scDamID, CEL-Seq and scDam&T-seq applied to KBM7 cells.
a) Schematic overview of scDam&T-seq. b) Binarized OE values (black: OE >= 1) of Dam-LMNB1 signal on chromosome 17, measured with scDam&T-seq and scDamID2 in 75 single cells with highest sequencing depth. Each row represents a single cell; each column a 100-kb bin along the genome. Unmappable genomic regions are indicated in red along the top of the track. c) Distribution of inter-GATC distances of mappable GATC fragments genome-wide (dotted line), and observed in experimental data with scDamID and scDam&T-seq for Dam-LMNB1. d) Distributions of the number of unique genes detected using CEL-Seq2 and scDam&T-seq on the same Dam-LMNB1 clone. e) Distribution of the number of unique transcripts detected by CEL-Seq (top) and scDam&T-seq for Dam and Dam-LMNB1 clones with varying DamID adapter concentrations.

