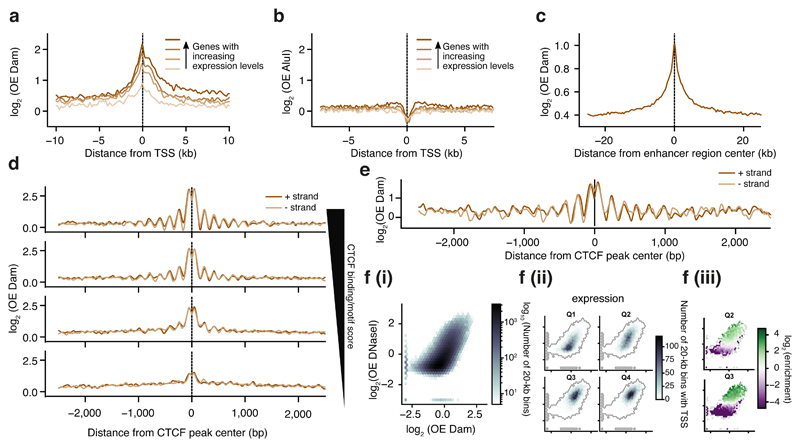
Figure 2. Untethered Dam marks accessible chromatin in single cells.
a) Log-transformed OE-values (log2OE) of Dam signal from an in silico population sample on TSS of genes grouped into four equal-sized categories with increasing expression levels (ordered light to dark). b) log2OE values obtained from AluI-derived fragments for identical TSSs as in (a). c) log2OE values of Dam signal from an in silico population sample at active enhancers (see methods for more details defining active enhancers). d) log2OE values of Dam signal from an in silico population sample at CTCF sites, stratified in four regimes of increasing CTCF binding activity (see methods for details on stratification). e) Example of log2OE Dam signal of a single-cell sample at CTCF sites with the highest CTCF binding activity. f) Relation between DNaseI (y-axis) and in silico population Dam data (x-axis): (i) Density of genomic 20-kb bins. (ii) Density of 20-kb bins with (one or more) TSSs of a gene, stratified in four gene expression quartiles from lowest (Q1) to highest (Q4) expression. (iii) Significant enrichment (red) and depletion (blue) of transcribed 20-kb regions for the two expression quantiles (Q2 and Q3). Points in the plot with fewer than 10 20-kb bins were kept gray, as well as (statistically) insignificant enrichments/depletions (see methods).

