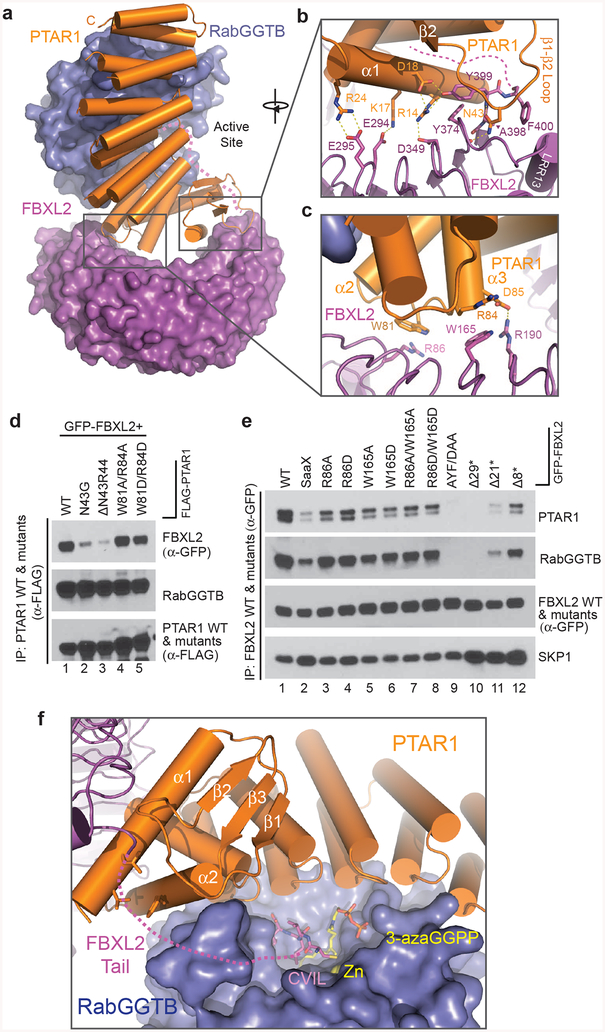
Figure 5. Multivalent FBXL2-GGTase3 interface.
(a) A top view of the overall FBXL2-GGTase3 interface formed by PTAR1 (orange ribbons) and FBXL2 (magenta surface).
(b,c) Close-up views of the PTAR1-FBXL2 interface made by the C-terminal and N-terminal FBXL2 LRRs. Select interface residues are shown in sticks. Dashed yellow lines represent a network of hydrogen bonds and polar interactions. The disordered C-terminal tail of FBXL2 is shown as dashed magenta line.
(d) HEK-293T cells were co-transfected with GFP-tagged FBXL2 and either wild-type (WT) FLAG-tagged PTAR1 or the indicated mutants. Twenty-four hours post-transfection, cells were harvested for immunoprecipitations and immunoblotting. The experiment was repeated three times. Representative result is shown. Uncropped blot/gel images are shown in Supplementary Data Set 1.
(e) HEK-293T cells were transfected with either GFP-tagged WT FBXL2 or the indicated GFP-tagged mutants. Twenty-four hours post-transfection, cells were harvested for immunoprecipitations and immunoblotting. The experiment was repeated three times. Representative result is shown. Uncropped blot/gel images are shown in Supplementary Data Set 1.
(f) A model of FBXL2 C-terminal CVIL motif at the active site of GGTase3 in presence of a GGPP analog. The zinc ion is shown in yellow sphere and is buried in the catalytic pocket of RabGGTB (slate surface). The disordered FBXL2 C-tail is shown as magenta dashed line with modeled CVIL motif as magenta sticks. A GGPP analog, 3-azaGGPP, is shown as sticks with the geranylgeranyl group in yellow and the pyrophosphate in orange. The residues in the α1 and α2 helices of PTAR1-NTE forming the hydrophobic patch possibly interacting with the FBXL2 tail are shown in orange sticks.

