Figure 1.
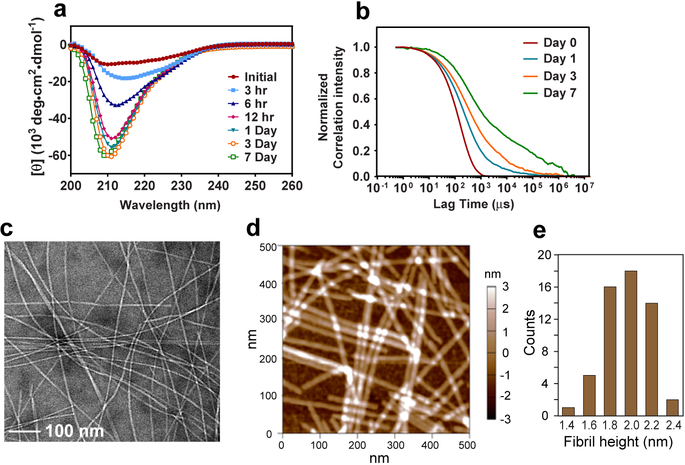
Glucagon forms well-ordered amyloid fibrils at acidic pH. a, Circular dichroism spectra of 8 mg/mL glucagon solution over 7 days. Predominantly β-strand spectra are observed within 12 hours. b, Autocorrelation functions of scattered light intensities show slower and more disperse decays over time, indicating an increase in the average particle sizes and the polydispersity of particle sizes. c, Representative negative-stain TEM image of glucagon fibrils, showing predominantly straight fibrils with occasional twists. d, AFM image of the glucagon fibrils, showing an average height of 1.97±0.22 nm (mean and s.d. of n = 56 measurements of fibrils), consistent with a dimer unit in the cross section normal to the fibril axis. e, Histogram of fibril height statistics from the AFM image, showing a peak at ~2 nm.

