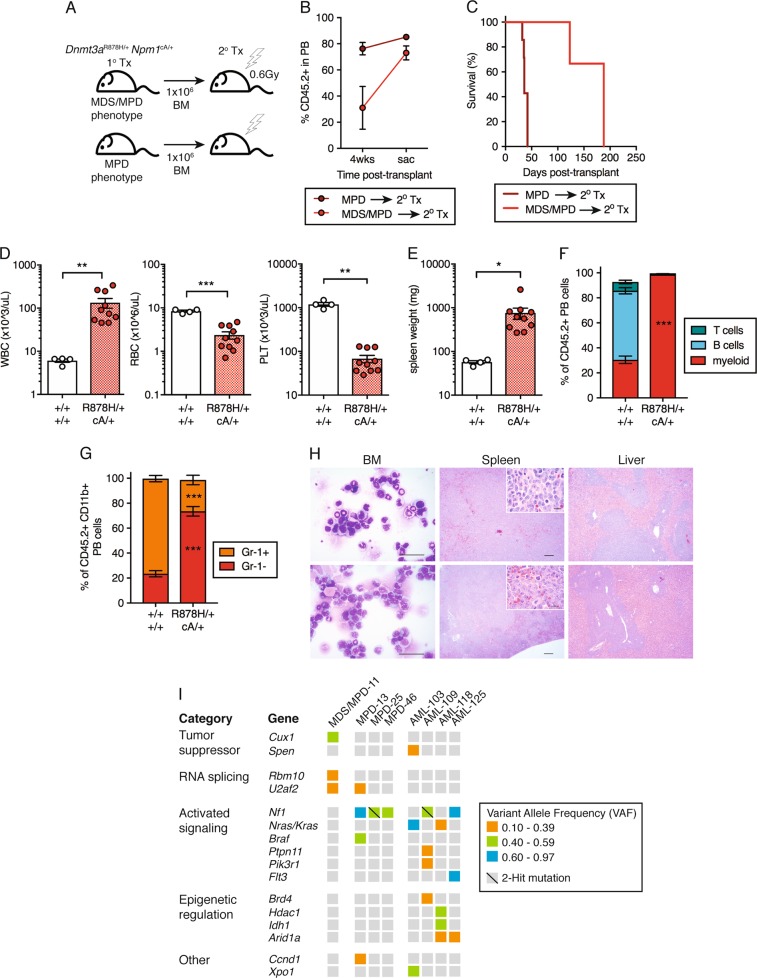
Fig. 4.
Dnmt3aR878H/+ Npm1cA/+ MPD progresses to AML following transplantation. a Experimental design for non-competitive secondary transplantation of Dnmt3aR878H/+ Npm1cA/+ BM MNCs from primary recipient mice with MDS/MPD or MPD phenotypes. b Frequency of donor-derived (CD45.2+) cells in PB of secondary recipient mice at 4 weeks post-transplant and at time of sacrifice. Dots represent mean ± s.e.m. (MPD, n = 7; MDS/MPD, n = 3). Results are from three independent experiments. c Overall survival of secondary transplant-recipient mice (MPD, n = 7; MDS/MPD, n = 3). d WBC, RBC, and PLT counts and e spleen weights of moribund mice (control, n = 4; +/+ cA/+, n = 10). f Frequency of myeloid, B, and T cells within the donor-derived CD45.2+ fraction in PB and g Gr-1+ and Gr-1− cells within donor-derived myeloid PB of moribund mice (control, n = 3; +/+ cA/+, n = 10). h Representative Giemsa-stained BM cytospins (far left; 40×, scale bars are 40 μm) and H&E-stained spleen (center; 4×, scale bars are 100 μm) (inset: 40×, scale bars are 40 μm) and liver sections (far right; 4×, scale bars are 100 μm) from moribund recipient mice. i Somatic, nonsynonymous mutations in individual genes and sets of genes, grouped into five categories. Orange boxes indicate mutations at VAF 0.10-0.39; green boxes, VAF 0.40–0.59; blue boxes, VAF 0.60–0.97. In all graphs unless otherwise specified, dots represent individual mice, bars indicate mean ± s.e.m. *P < 0.05; **P < 0.01; ***P < 0.001

