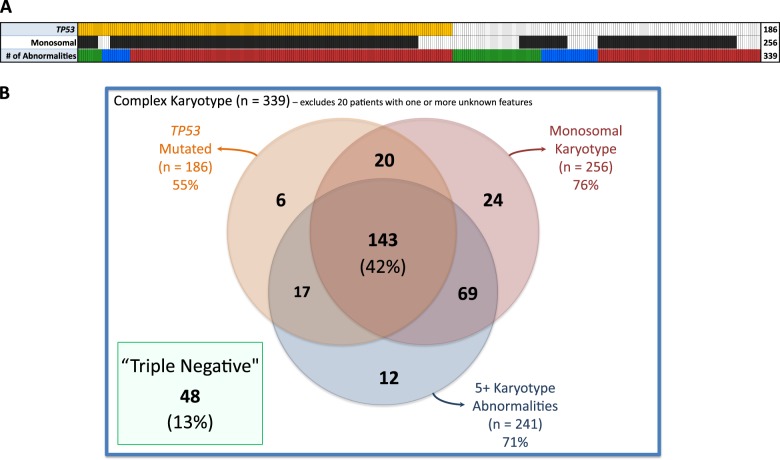
Fig. 2.
Interaction between TP53 mutation, monosomy, and number of karyotype abnormalities. a Each column represents an individual patient with orange and black bars indicating TP53 mutation and monosomal karyotype respectively. Colored bars in the last row indicate the number of karyotype abnormalities with green representing 3, blue representing 4, and red representing 5 or more. b Venn diagram showing number of cases with overlapping features

