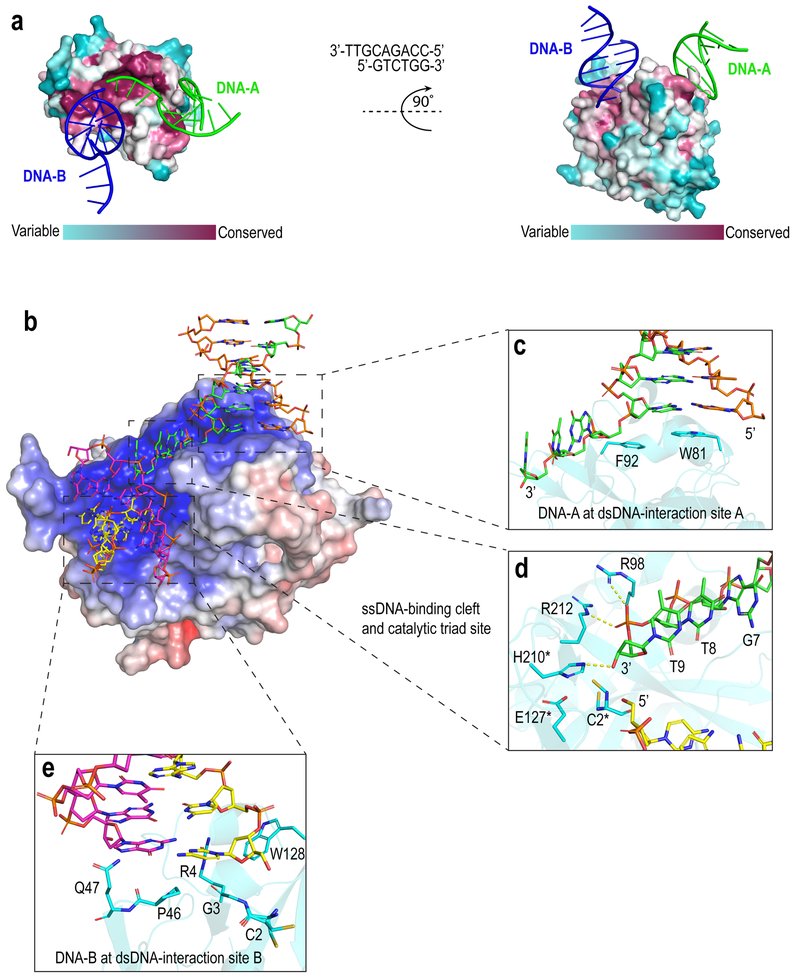
Figure 1. Interactions between SRAPd and 3’overhang DNA.
(a) Surface representation of SRAPd colored by degree of sequence conservation, bound to two symmetry-related DNA molecules shown in green (DNA-A) and blue (DNA-B). Evolutionary conservation was assessed by ConSurf web server13. The 3’ overhang DNA sequence that was used for co-crystallization is shown in the middle. (b) Electrostatic surface potential representation of SRAPd interacting with two symmetry-related DNA molecules: DNA-A in green and orange, and DNA-B in magenta and yellow. SRAPd surface color indicates electrostatic potential ranging from −7kT/e (red) to +7kT/e (blue). Electrostatic surface potentials were calculated using APBS14. (c) Close-up view of the SRAPd dsDNA-interaction site A in stacked conformation with the duplex segment of DNA-A. (d) Close-up view of the SRAPd catalytic triad site and ssDNA-binding cleft bound to the phosphate backbone of the single-strand segment of DNA-A. The catalytic triad residues as well as R98 and R212 in the ssDNA-binding cleft are shown as stick models in cyan. The ssDNA segment of DNA-A is colored green and DNA-B colored yellow. The catalytic triad residues are marked with asterisk. (e) Close-up view of the SRAPd dsDNA-interaction site B, which stacks with the blunt-end of DNA-B.

