
Figure 3.
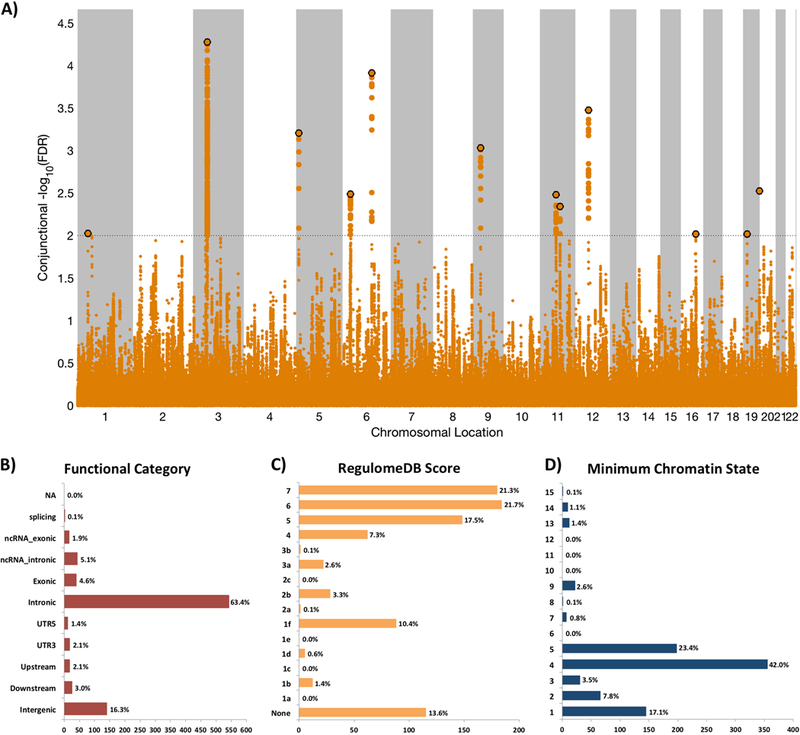
A) Common genetic variants jointly associated with bipolar disorder (n=59,315) and intelligence (n=269,867) at conjunctional false discovery rate (conjFDR) <0.01. Manhattan plot showing the -log10 transformed conjFDR values for each SNP on the y-axis and chromosomal positions along the x-axis. The dotted horizontal line represents the threshold for significant shared associations (conjFDR<0.01, ie -log10 (conjFDR)>2.0). Independent lead SNPs are encircled in black. Further details are provided in Supplementary Table 7. B) Distribution of functional consequences of SNPs in the shared genomic risk loci. C) Distribution of RegulomeDB score for SNPs in shared genomic loci, with a low score indicating a higher likelihood of having a regulatory function. D) The minimum chromatin state across 127 tissue and cell types for SNPs in shared genomic loci, with lower states indicating higher accessibility and states 1–7 referring to open chromatin states.