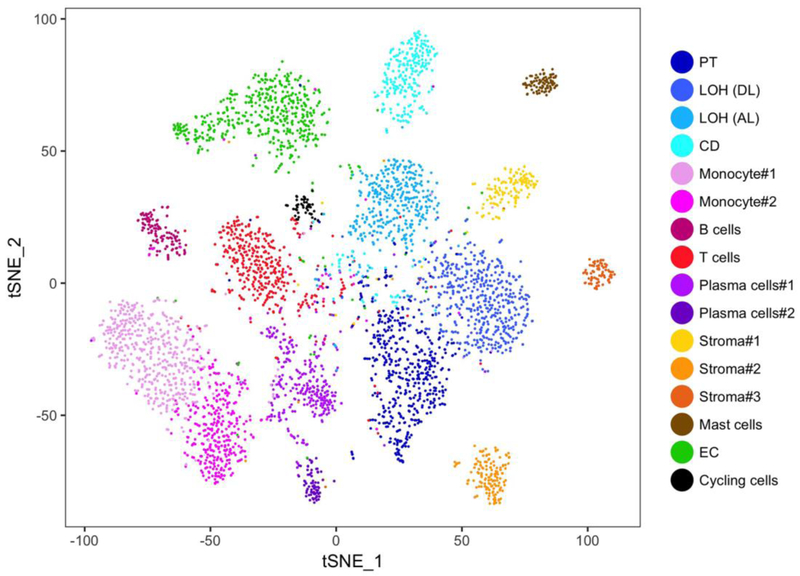
Figure 1. Comprehensive single-cell RNA sequencing of an allograft biopsy reveals diverse kidney and immune cell types. T-distributed stochastic neighborhood embedding.
(tSNE) plot of cell clusters identified from a human kidney allograft biopsy based on the expression of highly variable genes [19]. PT proximal tubule, LOH (DL) loop of henle, distal limb, LOH (AL) loop of henle, ascending limb, CD collecting duct, Mono monocyte, EC endothelial cells. Figure courtesy of Haojia Wu, PhD.

