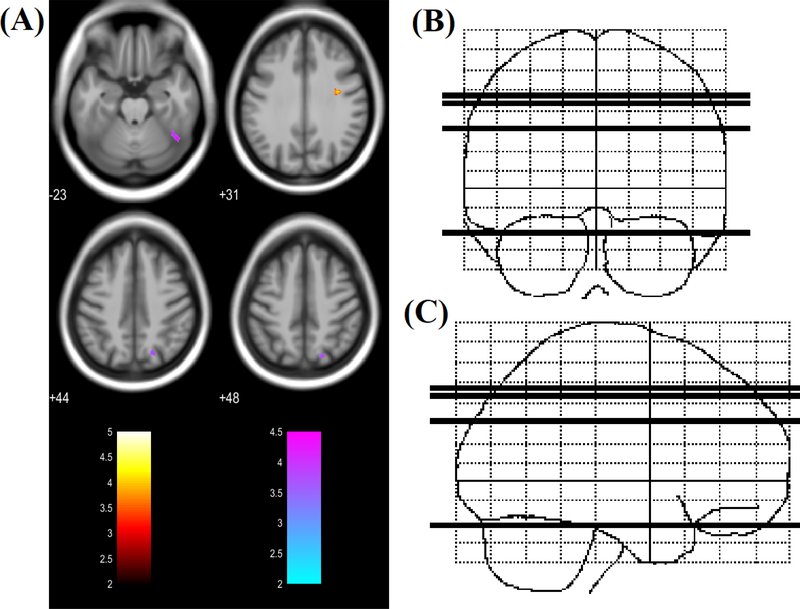
Figure 3:
(A) Regions of significantly increased RD (red to yellow) and decreased RD (blue to green) in PHIV-infected youths compared to healthy controls (t-statistic scale). Significance thresholds were set for P < 0.001 (uncorrected for multiple comparisons), with an extent threshold of 30 voxels for both analyses. Voxels evidencing significant differences in RD are displayed on axial sections of a canonical brain image with the color scale indicating the magnitude of Z values. The right side of the images represent the right side of the brain. Numbers indicate Z coordinates in mm relative to the SPM template. (B) & (C) Sketch indicating location of 4 axial slices in coronal and sagittal plane respectively.

