Figure 1.

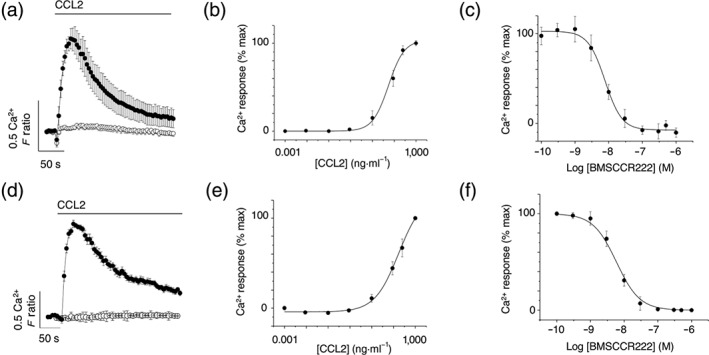
CCR2 is the cognate receptor for CCL2 in freshly isolated human monocytes and THP‐1 monocytic cells. (a) Averaged (n = 8) intracellular Ca2+ response to CCL2 (50 ng·ml−1) in freshly isolated CD14+ human monocytes. Response in the presence (open circles) and absence (closed circles) of 5‐μM U73122 (n = 6; P < .05). (b) Concentration–response curve for CCL2‐evoked responses in freshly isolated monocytes (n = 8; EC50 = 33 ± 4 nM). (c) Concentration–inhibition curve for selective CCR2 antagonist BMSCCR222 (IC50 = 9 ± 1 nM; n = 8) against Ca2+ responses evoked by CCL2 (50 ng·ml−1) in freshly isolated monocytes. (d) Averaged (n = 6) intracellular Ca2+ response to CCL2 (50 ng·ml−1) in THP‐1 cells. Response in the presence (open circles) and absence (closed circles) of 5‐μM U73122 (n = 6; P < .05). (e) Concentration–response curve for CCL2‐evoked responses in THP‐1 cells (n = 6; EC50 = 45 ± 12 nM). (f) Concentration–inhibition curve for BMSCCR222 (IC50 = 8 ± 1 nM; n = 6) against Ca2+ responses evoked by CCL2 (50 ng·ml−1) in THP‐1 cells. F ratio is the Ca2+ response as measured by the Fura‐2 emission intensity ratio when excited at 340 and 380 nm. Data in concentration–response/inhibition curves are expressed as a percentage of the control response in the presence of vehicle alone
