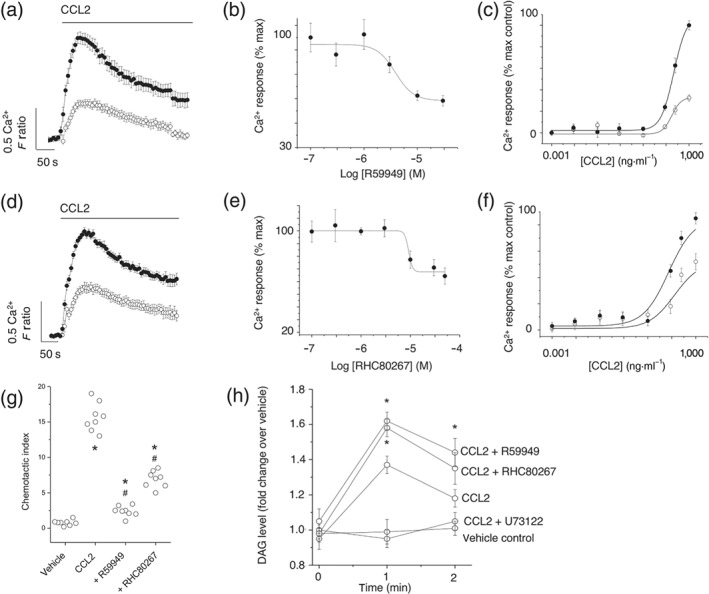
Figure 2.

Inhibitors of DAG kinase and DAG lipase attenuate CCL2‐evoked Ca2+ signalling and migration in THP‐1 cells. (a) Effect of DAG kinase inhibitor R59949 (30 μM) on Ca2+ responses evoked by CCL2 (50 ng·ml−1; n = 7). Averaged responses are shown in the presence of vehicle (closed circles) and inhibitor (open circles). (b) R59949 concentration–inhibition curve (IC50 = 9 ± 1 μM; n = 7) against Ca2+ responses evoked by CCL2 (50 ng·ml−1). (c) Effect of 30‐μM R59949 on CCL2 concentration–response curve (n = 7). (d) Effect of DAG lipase inhibitor RHC80267 (30 μM) on Ca2+ responses evoked by CCL2 (50 ng·ml−1; n = 7). Averaged responses are shown in the presence of vehicle (closed circles) and inhibitor (open circles). (e) RHC80267 concentration–inhibition curve (IC50 = 9 ± 1 μM; n = 7) against Ca2+ responses evoked by CCL2 (50 ng·ml−1). (f) Effect of 30‐μM RHC80267 on CCL2 concentration–response curve (n = 7). (g) Effect of R59949 (30 μM) and RHC80267 (30 μM) on THP‐1 transmigration to CCL2 (3 ng·ml−1). *P < .05 versus vehicle and # P < .05 versus CCL2 alone (n = 8). F ratio is the Ca2+ response as measured by the Fura‐2 emission intensity ratio when excited at 340 and 380 nm. Data in concentration–response/inhibition curves are expressed as a percentage of the control response in the presence of vehicle alone. (h) Biochemical measurement of DAG changes in THP‐1 cells. Cells preincubated for 30 min with U73122 (5 μM), R59949 (30 μM), or RHC80267 (30 μM) prior to CCL2 challenge (50 ng·ml−1) for 1 or 2 min (n = 6). Vehicle control; cells are preincubated with vehicle and not challenged with CCL2. *P < .05 versus CCL2 alone
