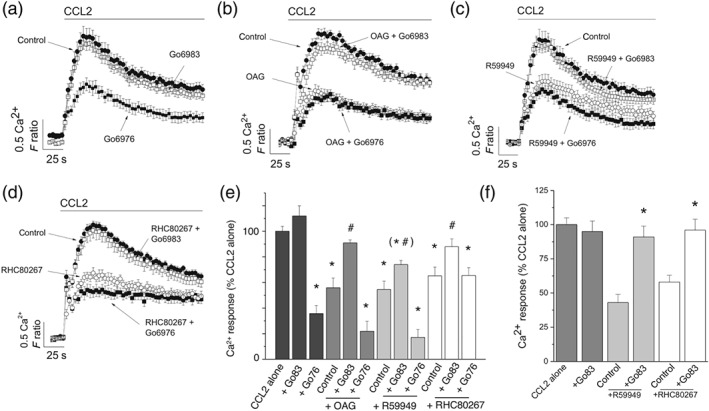
Figure 7.

Effect of inhibiting Ca2+‐dependent and Ca2+‐independent PKC isoforms on CCL2‐evoked responses following inhibition of DAG kinase and DAG lipase in THP‐1 cells and freshly isolated monocytes. (a) CCL2‐evoked intracellular Ca2+ responses in THP‐1 cells in the presence of vehicle control, Gö6976 (100 nM), or Gö6983 (100 nM; n = 8). (b) CCL2‐evoked intracellular Ca2+ responses in THP‐1 cells in the presence of vehicle control and OAG (30 μM) in the presence and absence of Gö6976 or Gö6983 (n = 8). (c) CCL2‐evoked intracellular Ca2+ responses in THP‐1 cells in the presence of vehicle control and R59949 (30 μM) in the presence and absence of Gö6976 or Gö6983 (n = 8). (d) CCL2‐evoked intracellular Ca2+ responses in THP‐1 cells in the presence of vehicle control and RHC80267 (30 μM) in the presence and absence of Gö6976 or Gö6983 (n = 8). (e) Bar chart showing averaged data from experiments (a–d). (f) Bar chart showing CCL2‐evoked Ca2+ responses in freshly isolated monocytes and the effect of R59949 (30 μM) and RHC80267 (30 μM), in the presence and absence of Gö6983 (100 nM; n = 8). All intracellular Ca2+ responses were evoked by 50‐ng·ml−1 CCL2. *P < .05 versus CCL2 and # P < .05 for combined inhibitors compared to OAG, R59949, or RHC80267 alone. F ratio is the Ca2+ response as measured by the Fura‐2 emission intensity ratio when excited at 340 and 380 nm. Data in inhibition experiments are expressed as a percentage of the control response in the presence of vehicle alone
