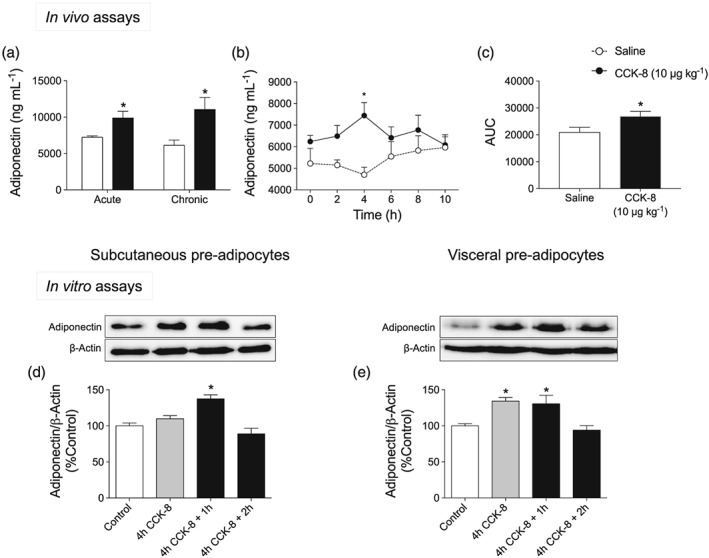
Figure 3.

Effect of CCK‐8 on adiponectin levels. (a) Effect of both acute and chronic administration of CCK‐8 (10 μg·kg−1) on plasma adiponectin concentration. (b) Time course of plasma adiponectin levels after acute treatment with CCK‐8 (10 μg·kg−1). This assay was carried out between 06:00 hr, when CCK‐8 was administered, and 16:00 hr. (c) AUC corresponding to the time course of plasma adiponectin levels plotted in panel (b). Panels (d) and (e) illustrate the effect of 10‐μM CCK‐8 on adiponectin release in subcutaneous and visceral pre‐adipocytes, respectively. Values are means ± SEM (n = 6 for in vivo and n = 5 for in vitro assays). *P < .05, significantly different from their respective controls; ANOVA with Bonferroni's test
