
Figure 1.
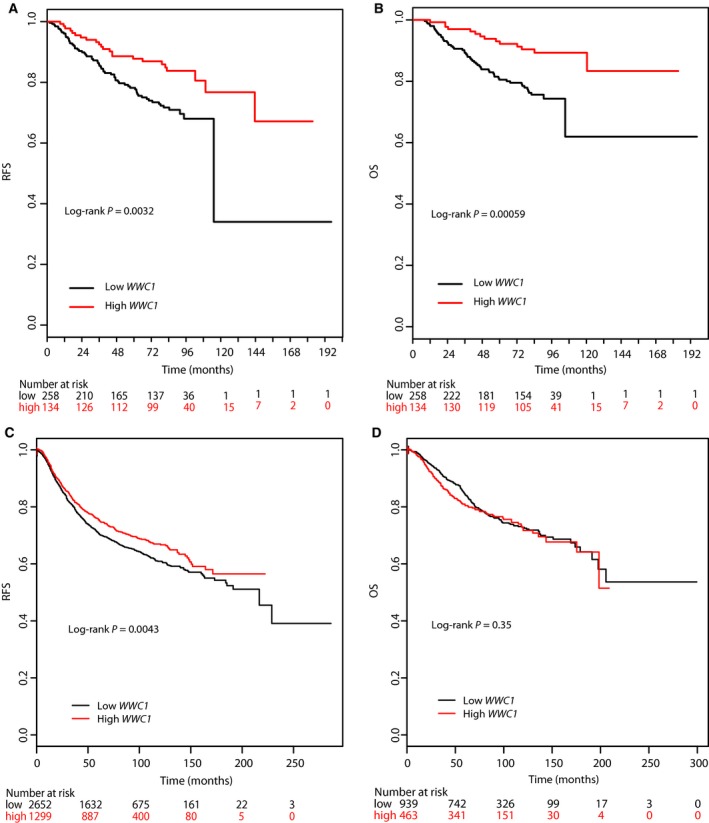
Kaplan–Meier survival curves in patients with high and low WWC1 expression. (A) RFS curves in patients of our study with high (upper tertile) and low (two lower tertiles) expression of WWC1. (B) OS curves in patients of our study with high (upper tertile) and low (two lower tertiles) expression of WWC1. (C) RFS curves in patients from online datasets with high (upper tertile) and low (two lower tertiles) expression of WWC1. (D) OS in patients from online datasets with high (upper tertile) and low (two lower tertiles) expression of WWC1.