
Figure 3.
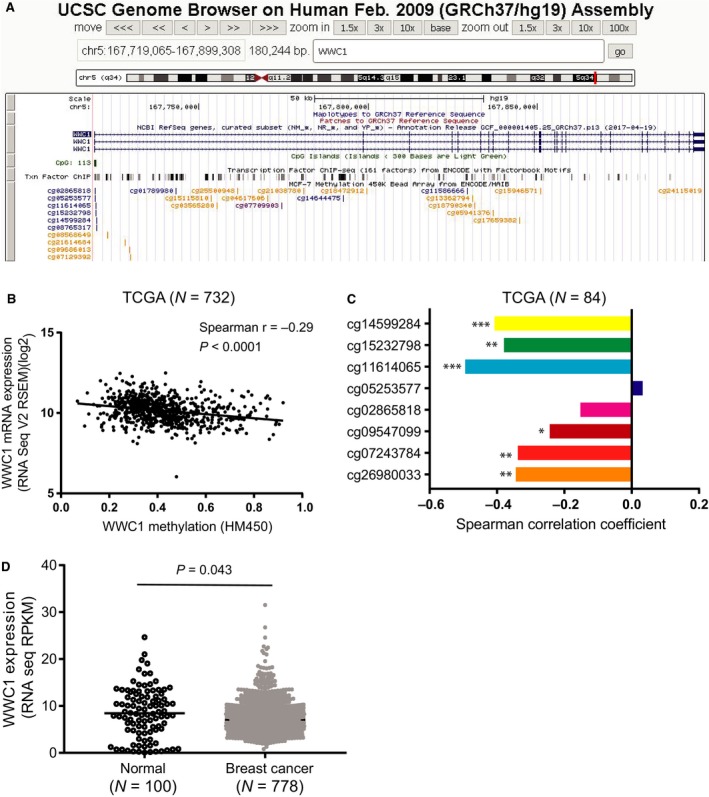
Correlation between WWC1 expression and methylation in breast cancer in the TCGA database. (A) A screenshot from the UCSC Genome Browser shows the CpG island in the WWC1 promoter and CpG site probes in the Illumina HumanMethylation450 BeadChip. (B) Scatter plot shows the Spearman correlation between WWC1 expression and methylation in all CpG sites in the WWC1 gene using the TCGA breast cancer data from cBioPortal. (C) Bar charts indicate the correlation coefficients between WWC1 expression and methylation in each of the 8 CpG sites located in the CpG island using data from the TCGA breast cancer and matched normal tissues (Spearman's rank correlation; *P < 0.05; **P < 0.001; ***P < 0.0001). (D) The WWC1 expression in normal tissue is higher than that in breast cancer using Student's t‐test.