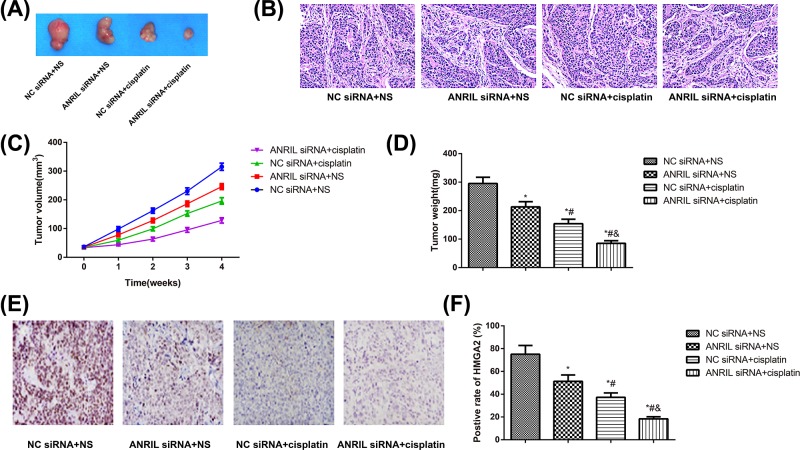
Figure 6. ANRIL siRNA increased cisplatin sensitivity in xenograft nude mice.
(A) Representative photographs of tumors in nude mice; (B) images are included to identify and define tumor histology; (C,D) The tumor growth curve (C) and tumor weight (D) of transplantation tumor of nude mice; (E,F) Expression levels of HMGA in each treatment group. Positive cells are stained brown. Quantified protein levels (area %) in representative xenograft tumors are shown; *, P<0.05 compared with the NC siRNA+NS group; #, P<0.05 compared with the ANRIL siRNA+NS group; &, P<0.05 compared with the NC siRNA+cisplatin group.

