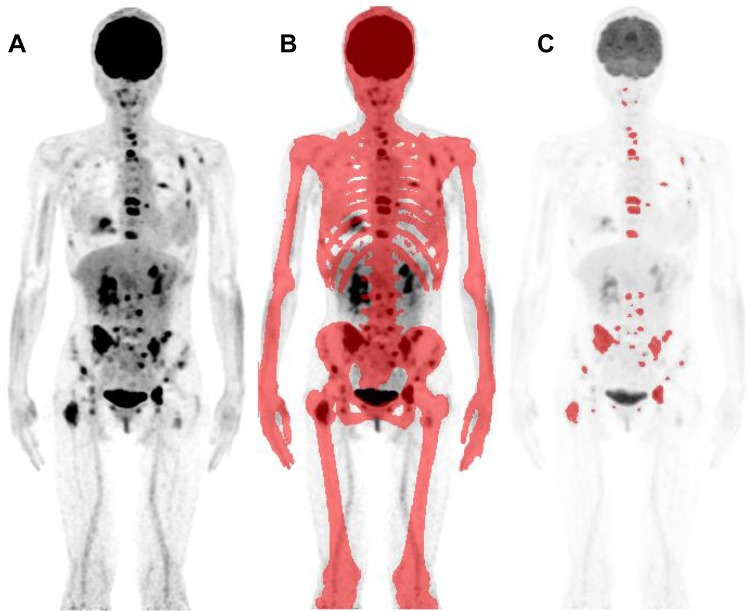
Fig. 1.
The process to obtain whole skeletal total lesion glycolysis (WS-TLG) was shown. Whole-body FDG–PET image (anterior view of maximum intensity projection; MIP) was taken (a). Bone areas were decided using CT attenuation (more than 152 HU, red areas) (b). The lesions above cutoff level (SUV > 4.0) were chosen (red lesions) (c). Each lesion’s TLG was calculated by the product of the volume and mean SUV of each bone lesion, and then, the summation of TLG values of whole skeletal lesions gave the WS-TLG value

